Gene Set Enrichment Analysis (GSEA)
GSEA identifies biological pathways that are coordinately regulated between conditions. Unlike DGE which focuses on individual genes, GSEA considers entire functional gene sets.
Pathway Concordance Score (PCS)
The PCS quantifies the agreement in pathway enrichment between original and synthetic datasets, following the same framework as the GCS.
Rank Score Calculation
For each pathway \(p\), a rank score integrates the direction and significance of enrichment:
PCS Formula
where \(N_\text{sig}\) counts concordant significant pathways, \(N_\text{non-sig}\) counts concordant non-significant pathways, \(\omega = 0.5\), and \(M\) normalizes based on the original pathway counts.
Code Example
The PCSAnalyzer class computes PCS and generates scatter plots:
from synomicsbench.metrics.narrow_utility.GSEA import PCSAnalyzer

analyzer = PCSAnalyzer(
    term_col="Term",
    nes_col="NES",
    q_col="FDR q-val",
    q_thr=0.05,
    w=0.5
)
or_gsea_df = pd.read_csv('original_gsea_result.csv')
syn_gsea_df = pd.read_csv('synthetic_gsea_result.csv')

# Process a single synthetic GSEA result
x, y, result = analyzer.process_single_gsea_result(
    gsea_ori=or_gsea_df,
    gsea_syn=syn_gsea_df
)

print(f"PCS: {result.pcs:.3f}")
print(f"Significant concordant pathways: {result.n_sign}")
Scatter Plot Visualization
The following code generates manuscript-quality PCS scatter plots using the Melanoma cohort as an example:
from synomicsbench.metrics.narrow_utility.GSEA import PCSAnalyzer

analyzer = PCSAnalyzer(
    term_col="Term",
    nes_col="NES",
    q_col="FDR q-val",
    q_thr=0.05,
    w=0.5
)

# Map method names to synthetic GSEA CSV paths
dataset_dict = {
    "Avatars K5": "GSEA/avatarsk5_0.csv",
    "Avatars K10": "GSEA/avatarsk10_0.csv",
    "CTGAN": "GSEA/ctgan_0.csv",
    "Gaussian Copula": "GSEA/gaussiancopula_0.csv",
    "Synthpop": "GSEA/synthpop_0.csv",
    "TVAE": "GSEA/tvae_0.csv",
}

fig, pcs_dict = analyzer.plot_gsea_datasets(
    ori_data="GSEA/original_data.csv",
    dataset_dict=dataset_dict,
    figsize=(9, 10)
)
fig.savefig("gsea_pcs_scatter.png", dpi=300, bbox_inches="tight")
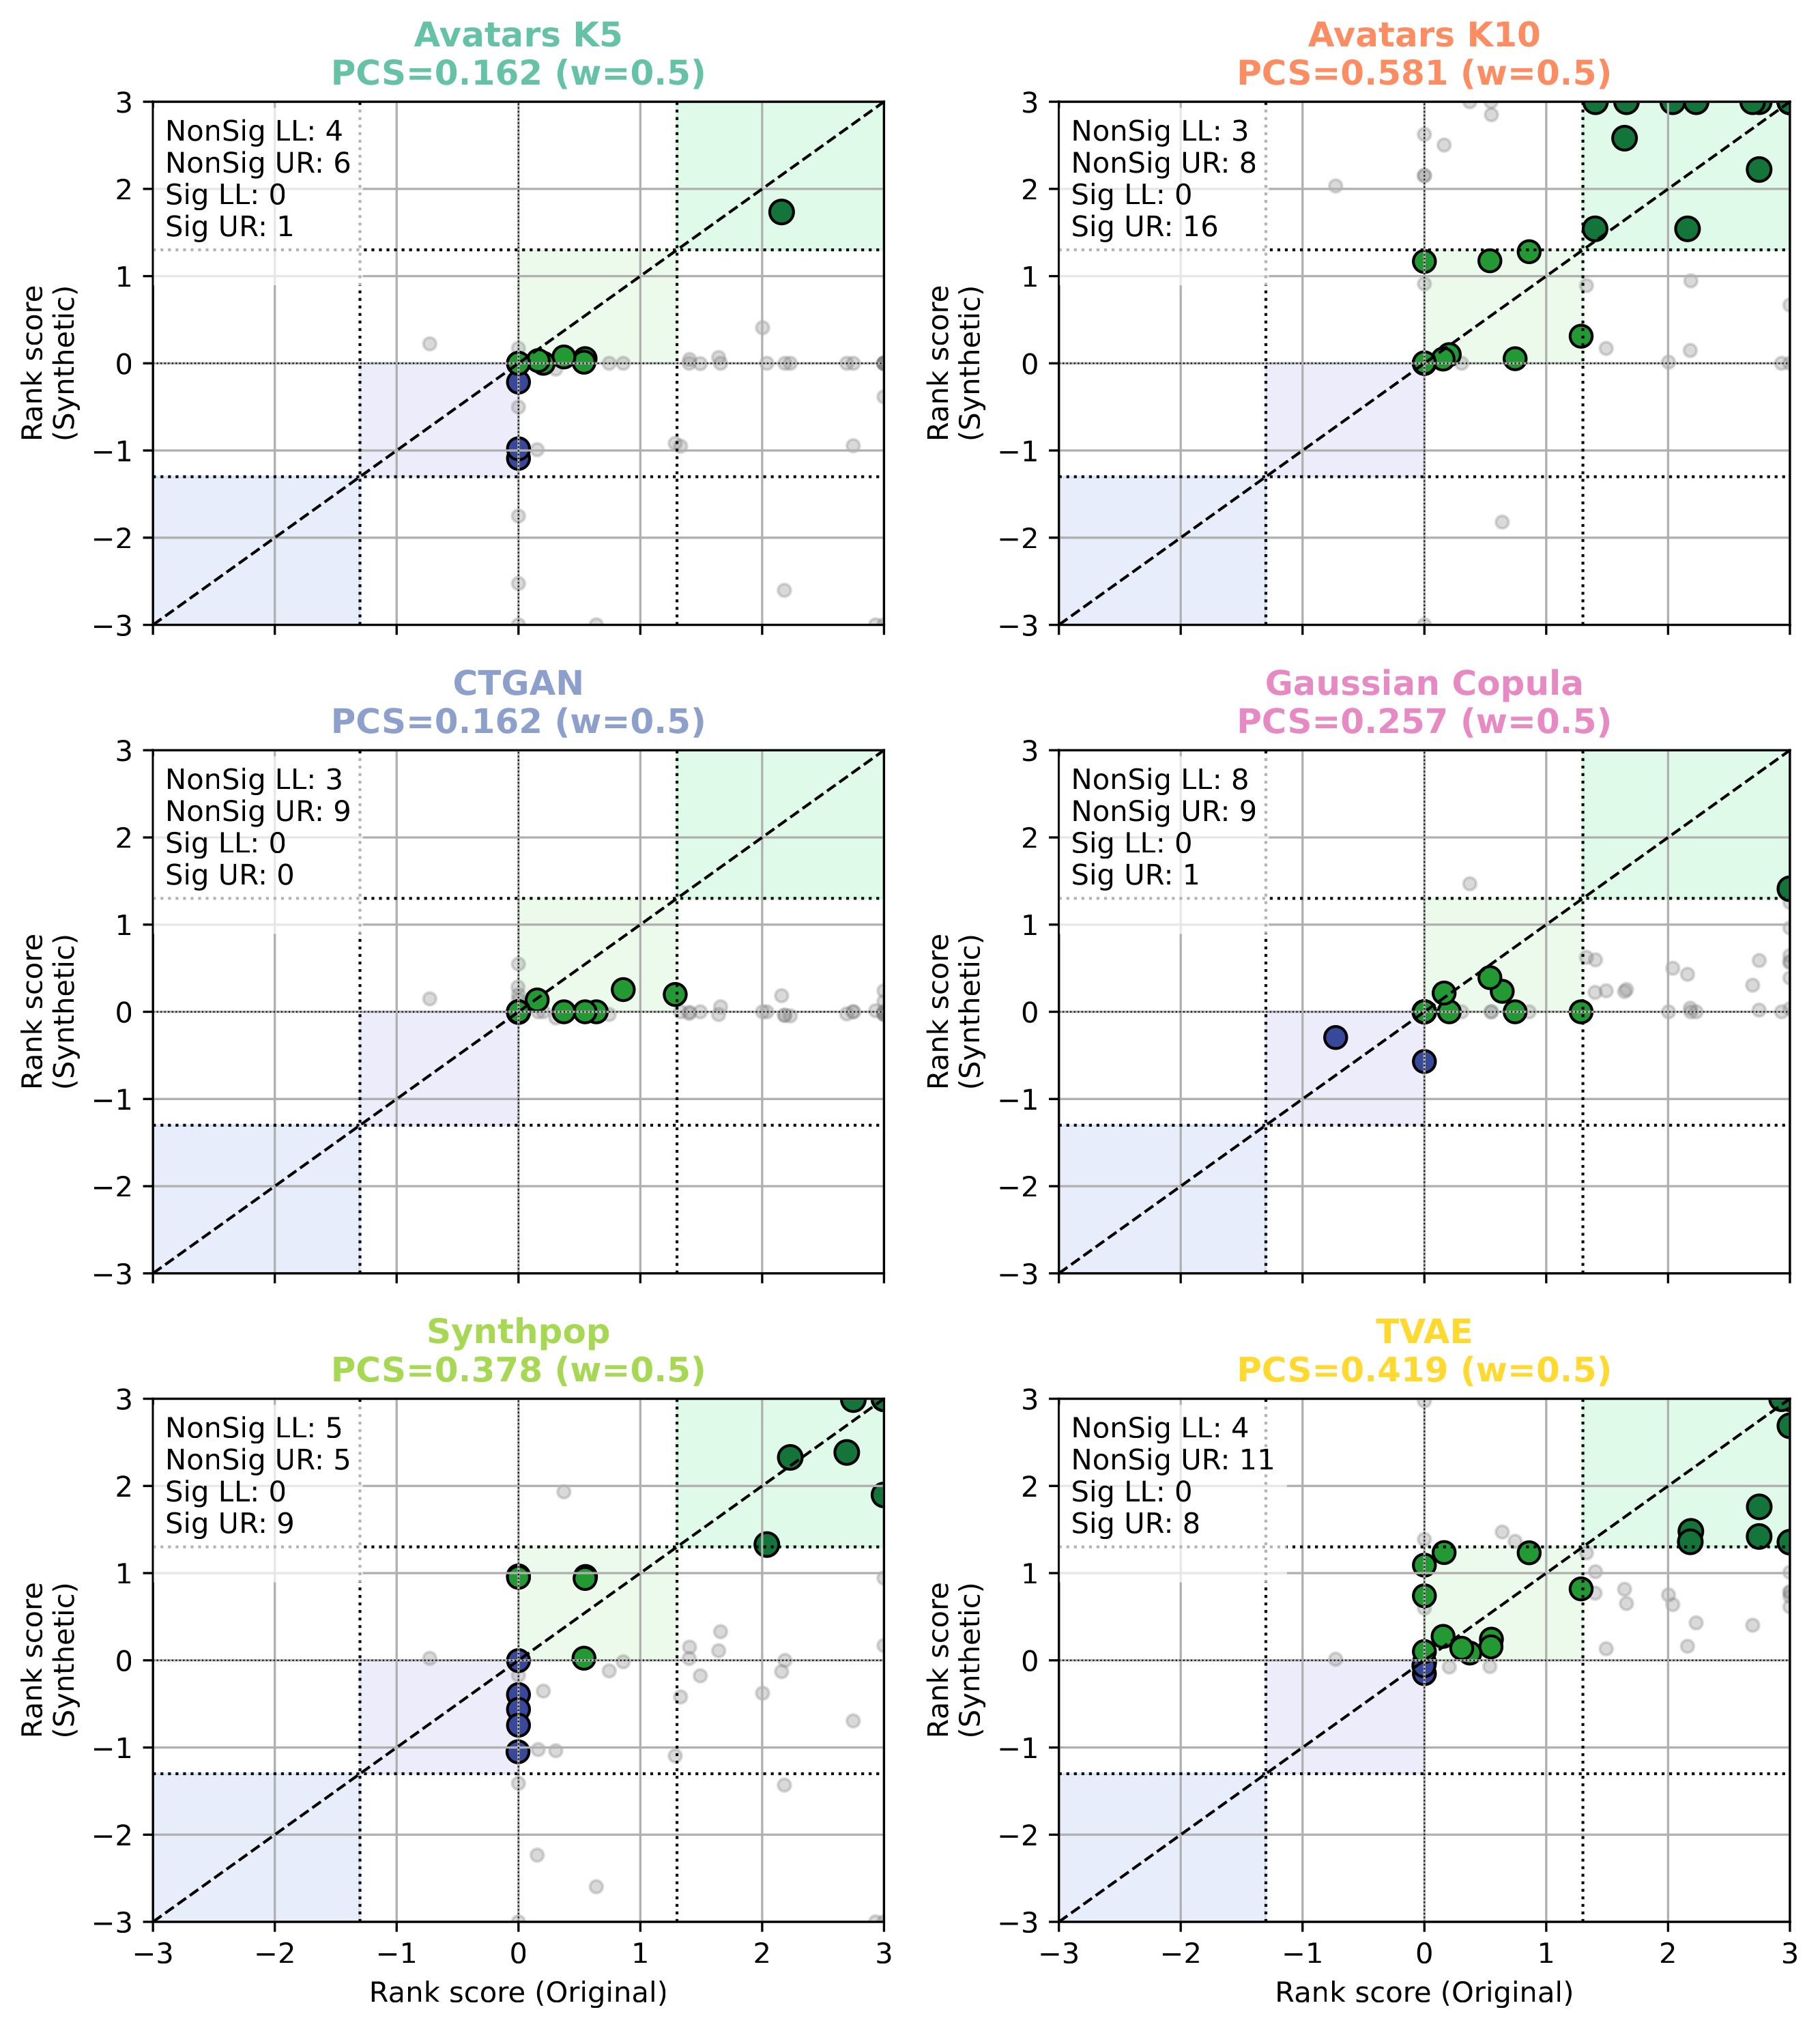
Scatter plots of pathway rank scores (Original vs. Synthetic) for each SDG method in the Melanoma cohort. The PCS value is shown in each panel.