Biological Rediscovery Results
Beyond metric-based evaluation, we re-implemented the analytical workflows described in the original clinical studies to determine whether established biomarkers and biological insights could be independently rediscovered from synthetic data. This page presents the biological rediscovery findings organized by cancer cohort, following the narrative of each original study.
ccRCC
Cohort: 311 patients with advanced clear cell renal cell carcinoma from CheckMate 009, 010, and 025 trials, treated with nivolumab (anti-PD-1). Original study by Braun et al. (Nature Medicine, 2020).
Braun et al. performed an integrated genetic, transcriptomic, and immunopathologic analysis of advanced ccRCC tumors, uncovering how somatic alterations—particularly PBRM1 mutations and 9p21.3 deletions—interact with immune infiltration patterns to modulate response to PD-1 blockade.
Differential Gene Expression
In the original study, Braun et al. identified that PBRM1 alterations are associated with increased angiogenesis gene expression. As illustrated in Figure 1, we re-applied this analysis to synthetic datasets: both Avatars (K5/K10) and Gaussian Copula successfully reproduced this clinical signal (Wilcoxon rank-sum test, P < 0.01). In contrast, CTGAN and Synthpop failed to capture the PBRM1–angiogenesis association.
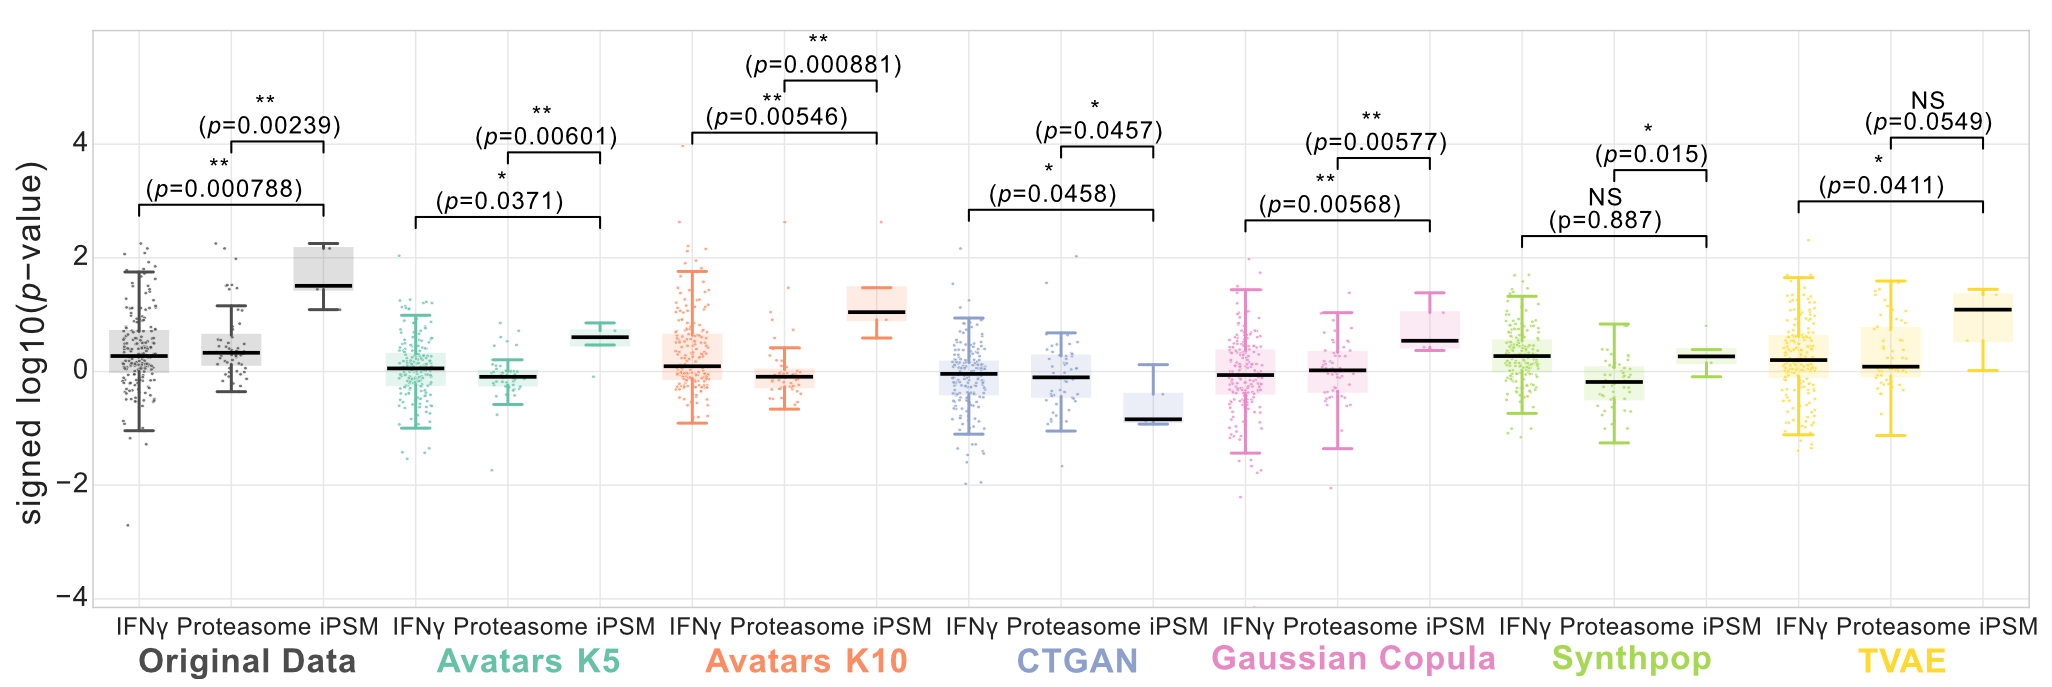 Figure 1: PBRM1 mutation-associated angiogenesis signal in ccRCC. Angiogenesis scores stratified by PBRM1 mutation status are shown. Statistical significance was assessed using a two-sided Wilcoxon rank-sum test.
Gene Set Enrichment Analysis
The original study revealed that 9p21.3 deletion was associated with a distinct pathway signature: increased EMT, mTORC1 signaling, angiogenesis, hypoxia, and glycolysis, alongside decreased oxidative phosphorylation, fatty acid metabolism, and TGF-β signaling. When we re-ran GSEA on synthetic datasets, Avatars (K5/K10) and Gaussian Copula reproducibly recapitulated the downregulated pathways—in particular fatty acid metabolism and oxidative phosphorylation. Upregulated pathways were harder to recover, with EMT being the only signal consistently detected across methods. Gaussian Copula demonstrated the best cross-replicate stability, including one replicate that was almost identical to the original full pathway pattern.
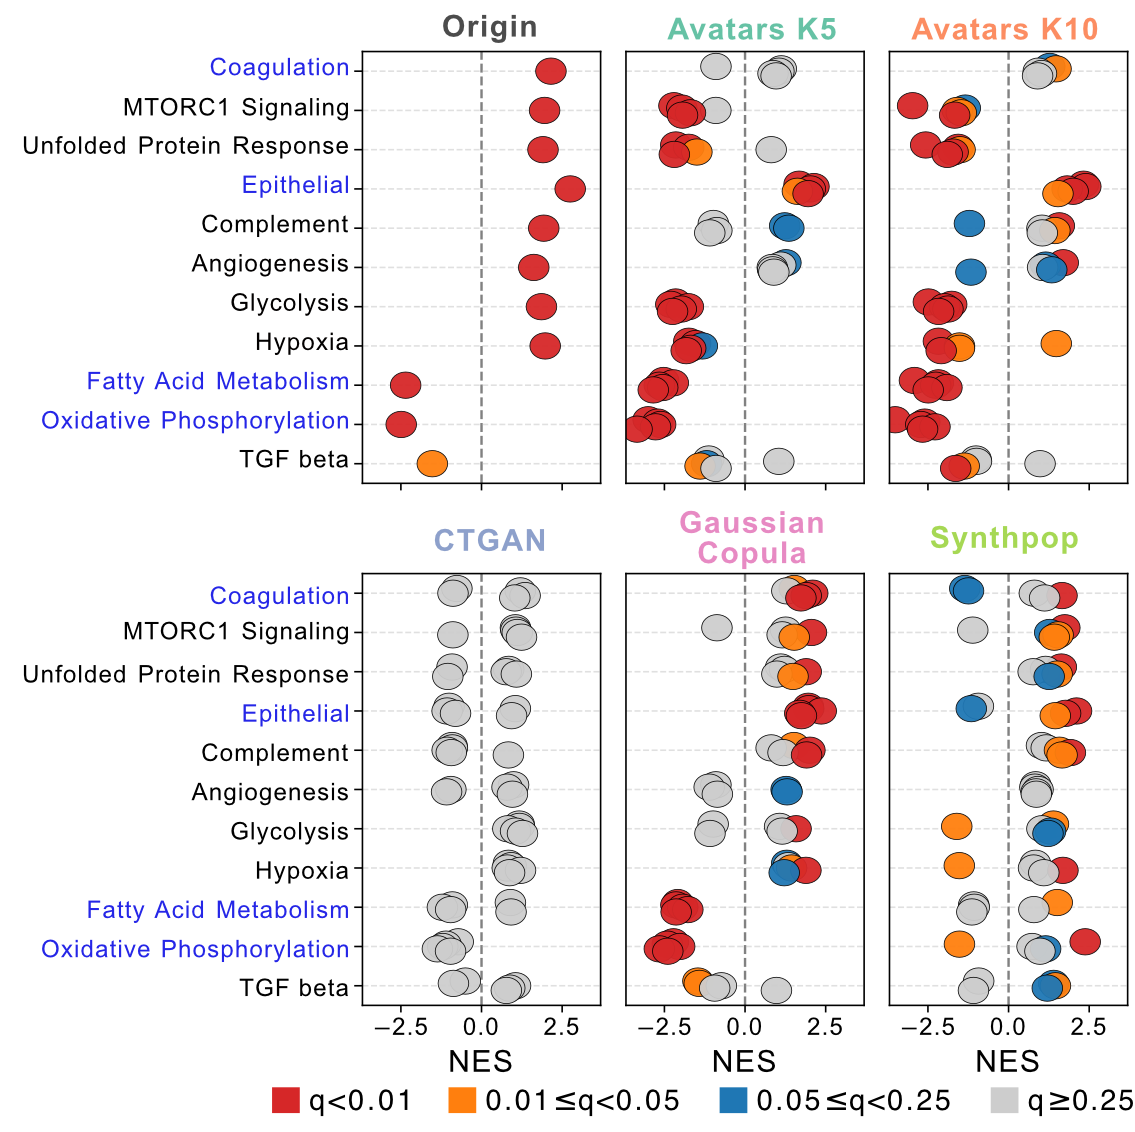
Figure 2: GSEA result of 9p21.3 deletion in ccRCC cohort. Bubble plots show NES values for Hallmark pathways in the original and synthetic datasets. Color indicates statistical significance.
Single-sample GSEA
At the individual sample level, Braun et al. showed that loss-of-function PBRM1 mutations were associated with reduced IL6-JAK-STAT3 signaling (Wilcoxon rank-sum test, P = 0.01). This signal was robustly reproduced by the Gaussian Copula across multiple synthetic replicates. Additionally, the direction and statistical significance of other pathways — including estrogen response, apoptosis, allograft rejection, and UV response — were also recovered by Gaussian Copula, whereas other SDG methods exhibited pronounced inter-replicacte variability.
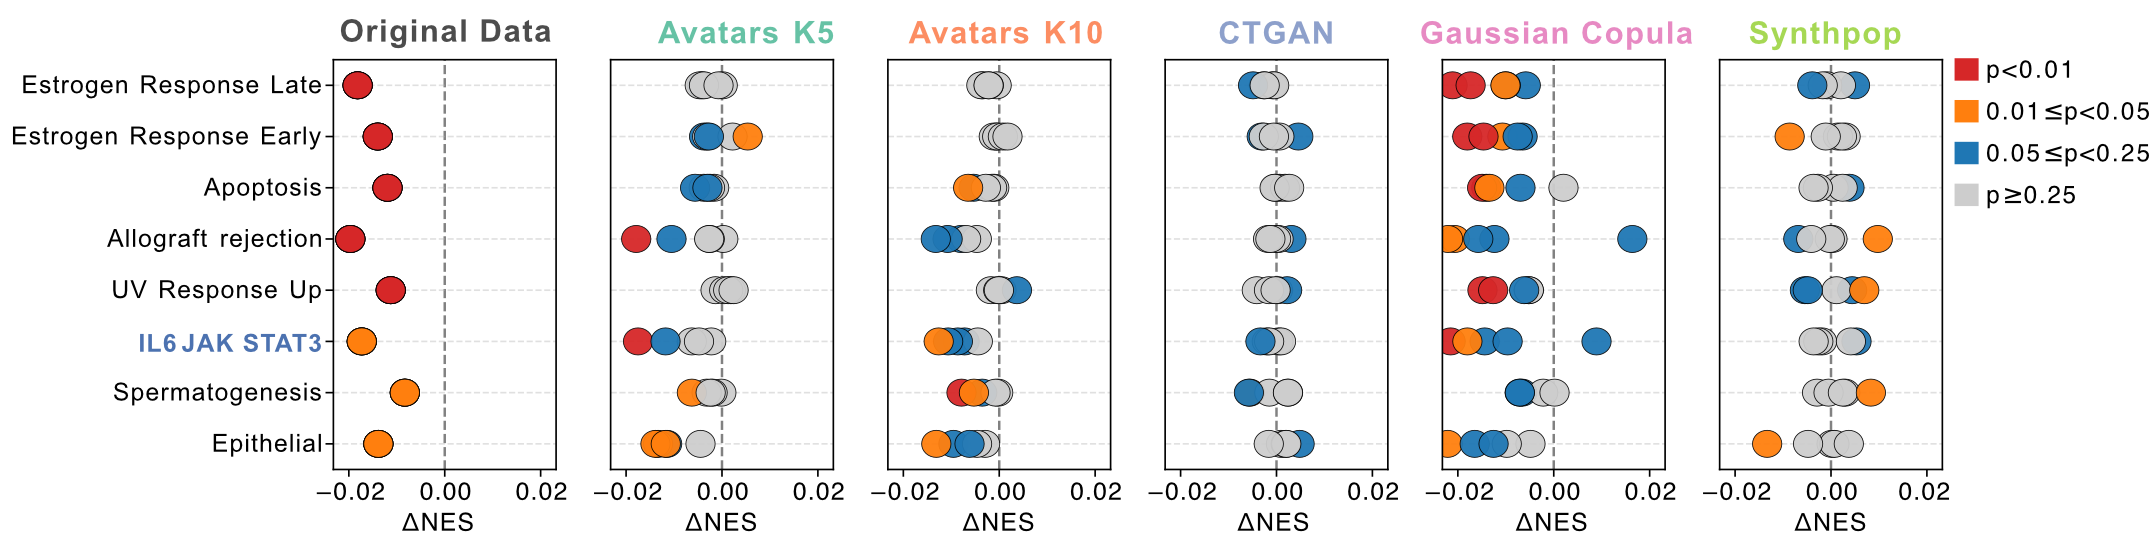 Figure 3: Association between ssGSEA signals and PBRM1 phenotype in the ccRCC dataset . Bubble plots compare differential NES between PBRM1 mutation patients and PBRM1 wildtype patients in original and synthetic datasets. Bubble color denotes P value thresholds (Wilcoxon rank-sum test). PBRM1 mutations were associated with reduced IL6-JAK-STAT3 signaling in the original cohort.
Cell Type Deconvolution
Using CIBERSORTx with the LM22 reference signature, differential analysis between immune-infiltrated and immune-excluded/desert tumors in the original ccRCC cohort identified enrichment of CD8+ T cells, follicular helper T cells, activated CD4+ memory T cells, and M1 macrophages in infiltrated tumors, whereas excluded/desert tumors exhibited higher proportions of M2/M0 macrophages, resting CD4+ memory T cells, resting NK cells, and eosinophils.
Among the SDG methods, only Avatars and Gaussian Copula managed to reconstruct immune contrasts at a near-significance level (Wilcoxon rank-sum test, FDR Q < 0.25). Importantly, reproducibility across synthetic replicates was achieved only for cell types with very strong significance in the original data (FDR Q < 0.05), such as CD8+ T cells and resting CD4+ memory T cells. For weaker or non-significant effects, corresponding synthetic results varied substantially between replicates.
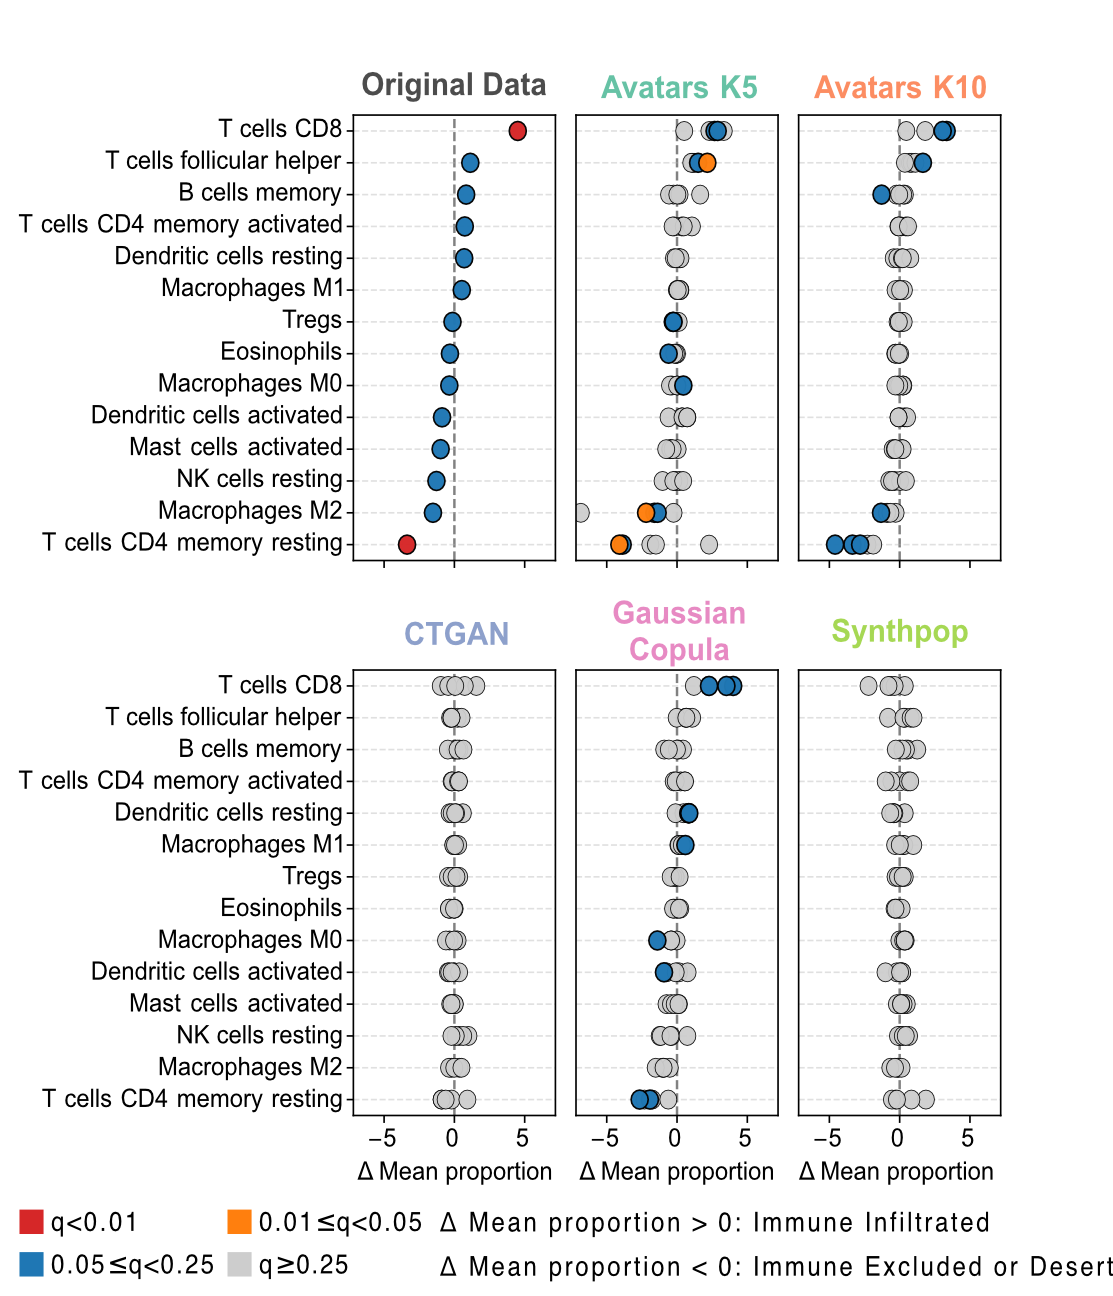
Figure 4: Differential LM22 immune cell proportions in ccRCC. Dot plots compare mean differences in immune cell fractions inferred by CIBERSORTx between immune-infiltrated and immune-excluded/desert tumors across the original and synthetic datasets generated by each SDG method. Colors indicate statistical significance based on a two-sided Wilcoxon rank-sum test with FDR adjustment.
Survival Analysis
Braun et al. demonstrated that patients harboring PBRM1 alterations exhibited improved overall survival compared with wild-type cases. This genotype–outcome association was faithfully recapitulated by Avatars K10 and Gaussian Copula (log-rank test, P < 0.05), indicating effective preservation of mutation-linked survival dependencies. Overall, Avatars (K5/K10) and Gaussian Copula preserved significant differences between responders and non-responders for both OS and PFS (log-rank test, P < 0.01). CTGAN retained significance for OS only, whereas Synthpop preserved significance for PFS only—indicating partial recovery of survival signals. TVAE was excluded from this cohort because it generated only a single treatment label across replicates.
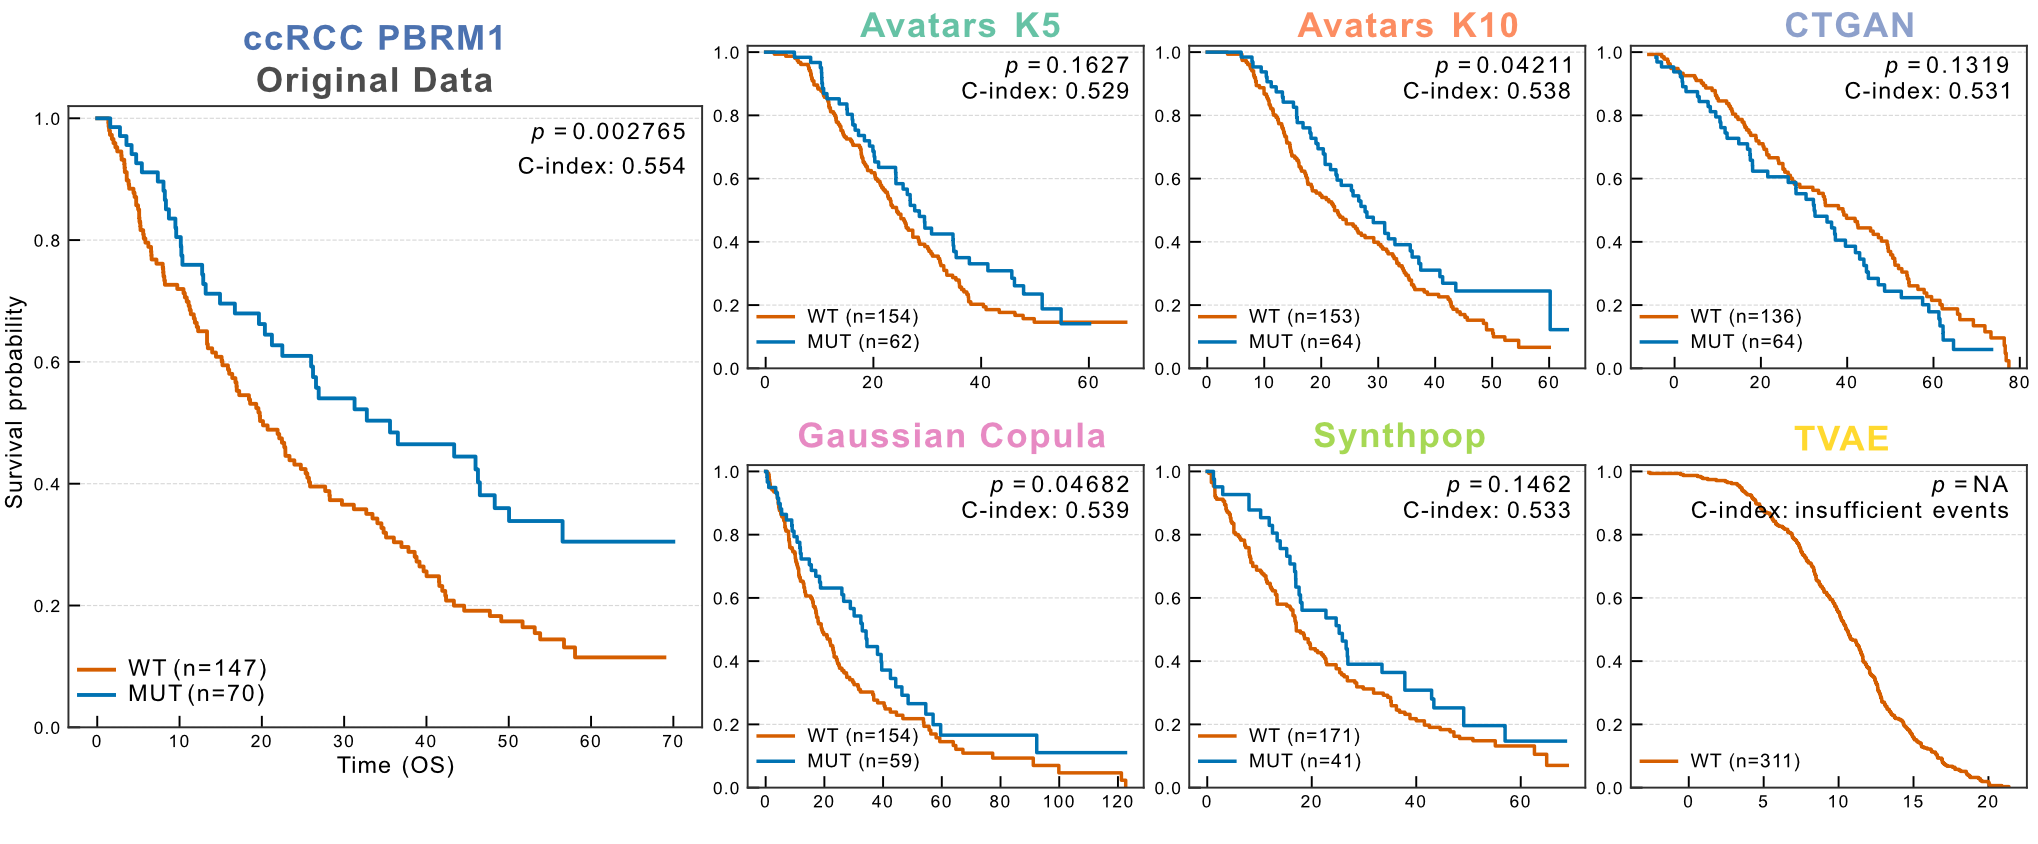 Figure 5: PBRM1-associated overall survival in ccRCC. Kaplan-Meier curves compare overall survival between PBRM1-mutant (blue) and wild-type (orange) groups in the original dataset and across synthetic cohorts generated by each SDG method. The original survival advantage of PBRM1-mutant patients is reproduced in selected synthetic datasets, with log-rank P values C-indices reported in each panel.
Melanoma
Cohort: 121 patients with metastatic melanoma treated with anti-PD1 immune checkpoint blockade. Original study by Liu et al. (Nature Medicine, 2019).
Liu et al. performed an integrative molecular analysis, discovering that MHC class II-associated gene expression, interferon response pathways, and immune cell composition were key determinants of anti-PD1 response, and developed parsimonious predictive models integrating clinical, genomic and transcriptomic features.
Differential Gene Expression
Liu et al. observed higher expression of 13 MHC class II-associated HLA genes in treatment responders, with four genes — HLA-DMA, HLA-DMB, HLA-DOA, and HLA-DOB — reaching statistical significance (Wilcoxon rank-sum test, P < 0.05). While Avatars (K5/K10), Gaussian Copula, Synthpop, and TVAE successfully captured responder upregulation, the statistical significance was notably attenuated in the Avatars K10 and Gaussian Copula cohorts (Figure 6a). In Avatars K10, only HLA-DOA and HLA-DOB maintained significance, whereas all genes in Gaussian Copula failed to meet the 5% threshold. Conversely, Avatars K5 and TVAE exhibited an elevation in false-positive gene identifications.
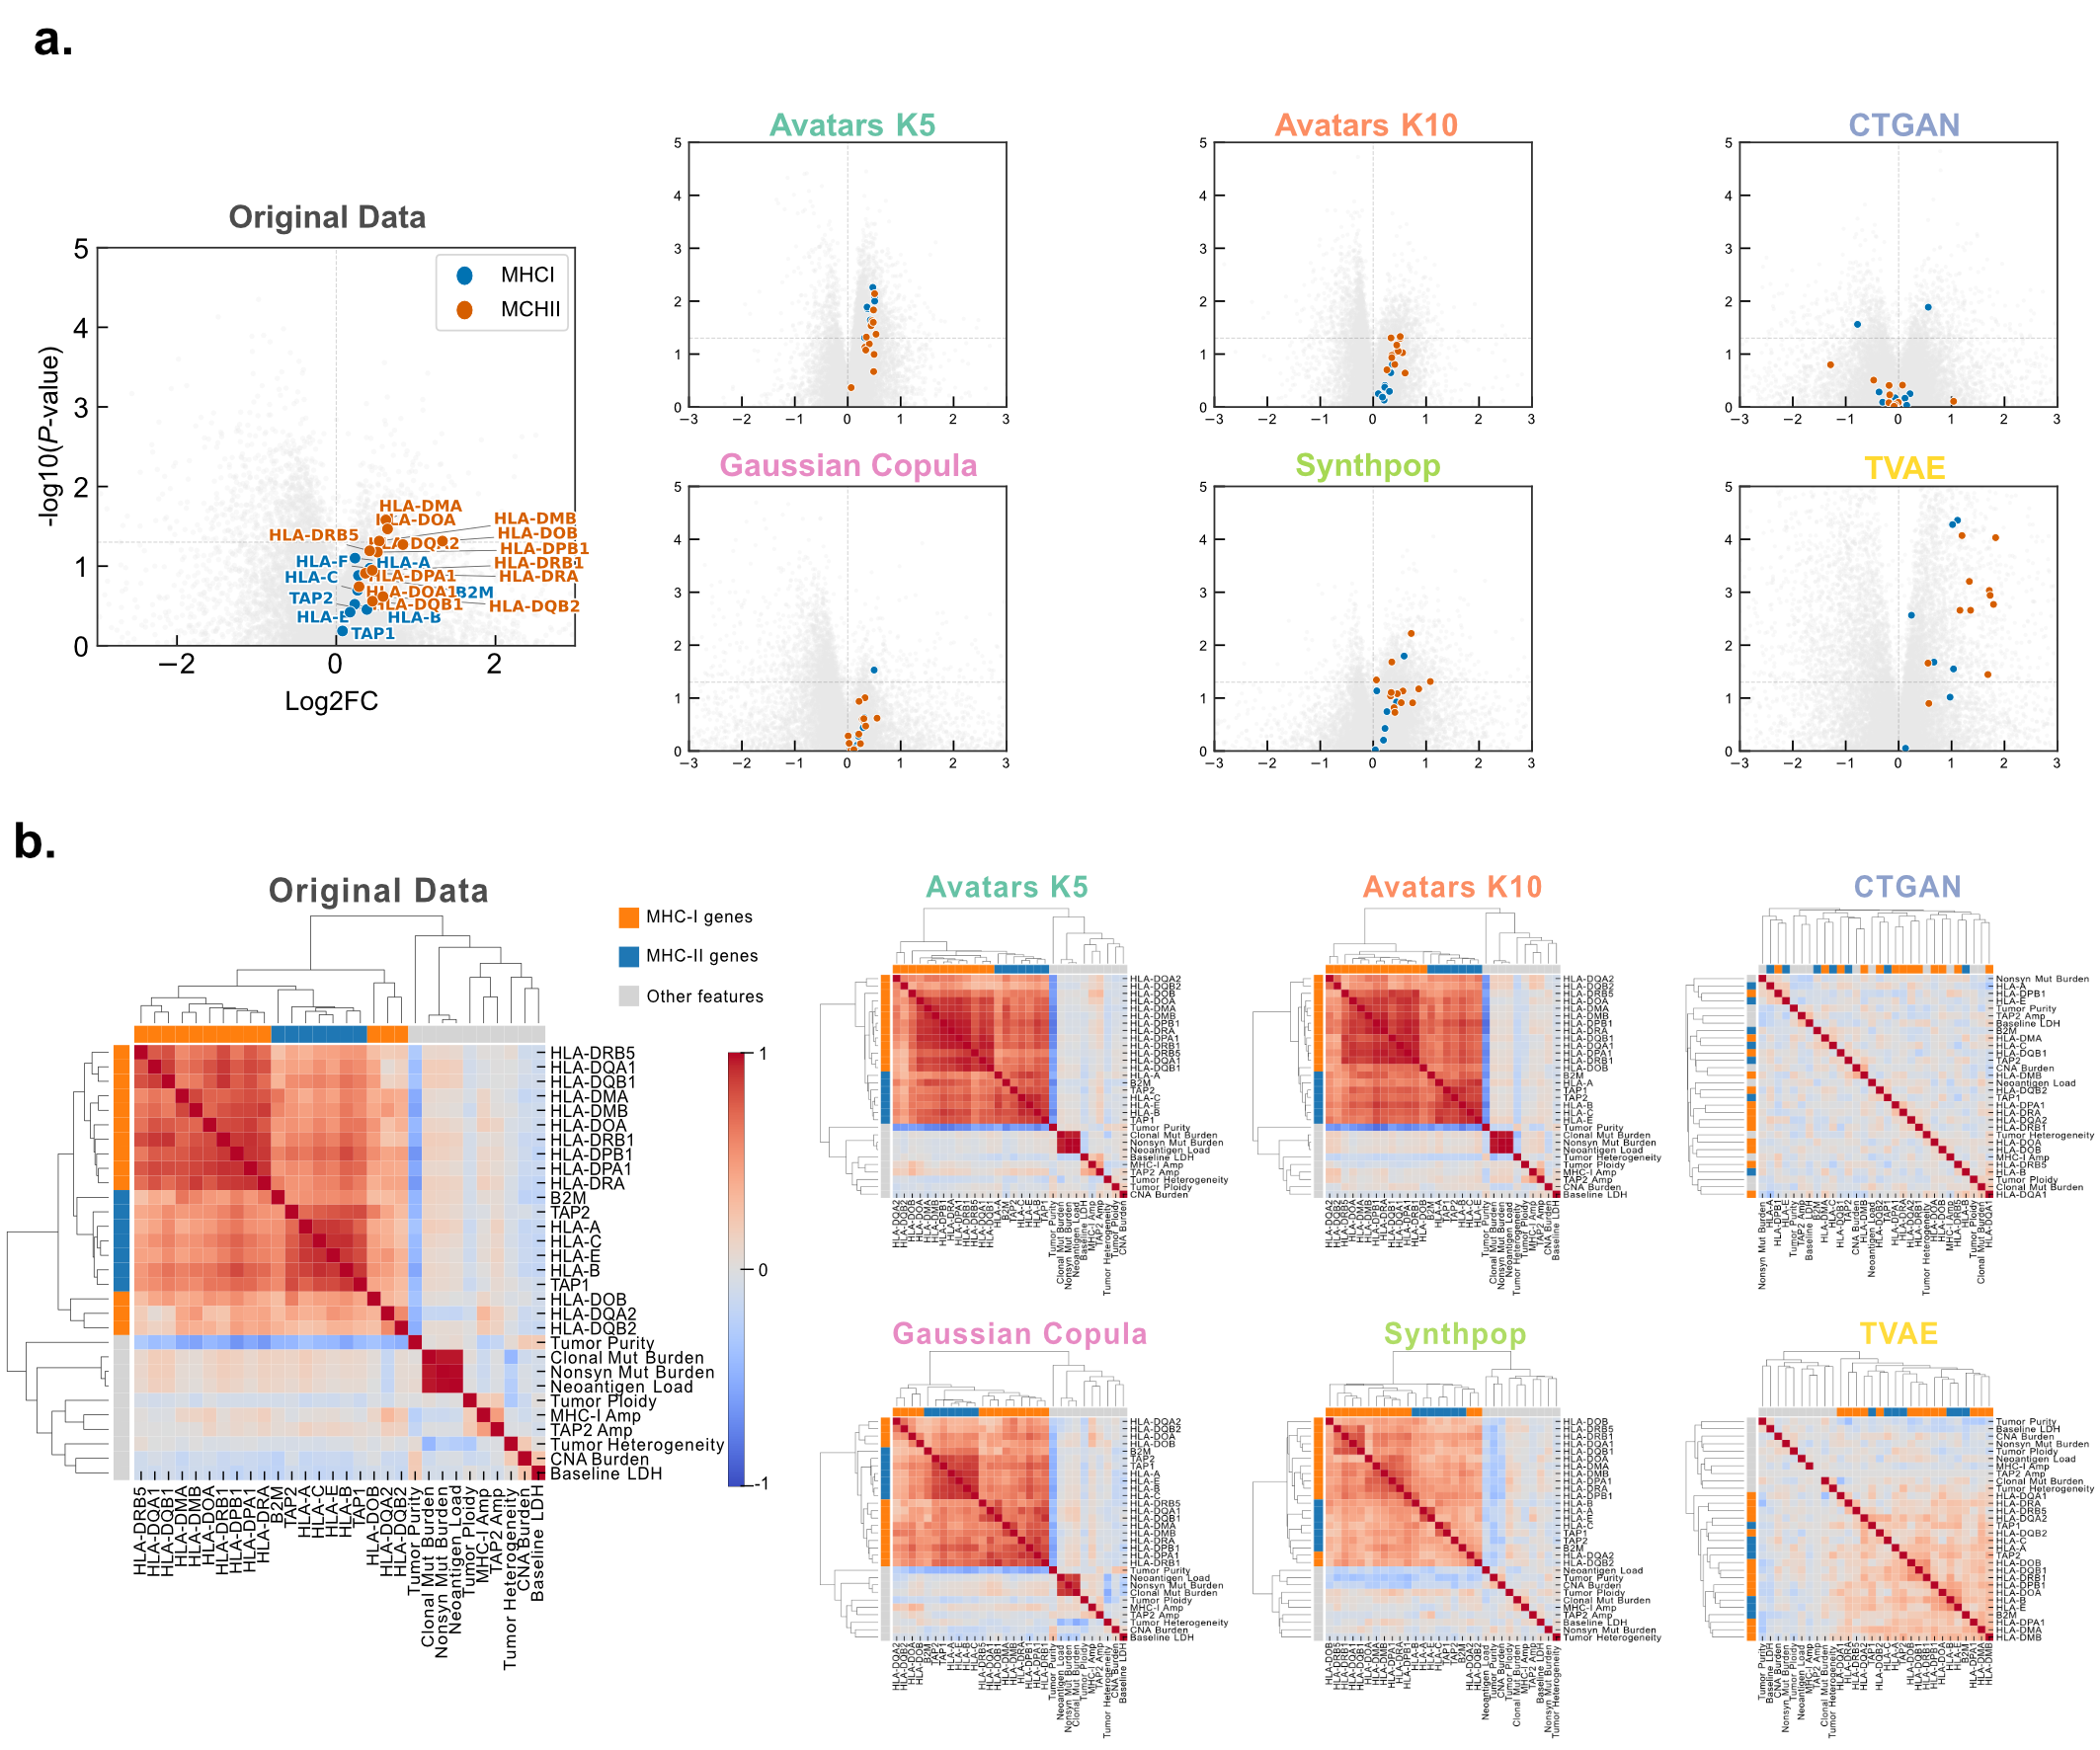 Figure 6: Preservation of responder-associated MHC gene signatures in melanoma. a) Volcano plots compare responders and non-responders. Highlighted points are MHC class I and MHC class II HLA genes. b) Hierarchical clustering of feature correlation matrices in the melanoma cohort. Correlation heatmaps with hierarchical clustering depict the structural organization of feature-feature associations in the melanoma dataset.
These MHC class II genes are part of a larger biologically coherent structure visible in hierarchical clustering of feature correlation matrices. As shown in Figure 6b, the original Melanoma data revealed a highly structured architecture with a prominent immune-related cluster containing distinct MHC class I and MHC class II subclusters, a separate mutation and neoantigen load cluster, and a strong negative correlation between tumor purity and the immune cluster — where reduced purity served as a proxy for increased immune infiltration. Significantly, Avatars (K5/K10) and Gaussian Copula successfully recapitulated these biologically coherent blocks, whereas CTGAN and TVAE produced noisy or excessively smoothed matrices that failed to maintain the integrity of these critical biological relationships.
Gene Set Enrichment Analysis
In the original cohort, five immune-related pathways (IFN-γ response, Allograft rejection, Complement, Inflammatory response, and IL6-JAK-STAT3 signaling) were enriched in responders, with no pathways enriched in progressors. These biological signatures were largely recovered by Avatars (K5/K10), Gaussian Copula, Synthpop, and TVAE, but not by CTGAN. Robust recovery across random seed replicates was only observed for Avatars K10, Gaussian Copula, Synthpop, and TVAE (Figure 7a).
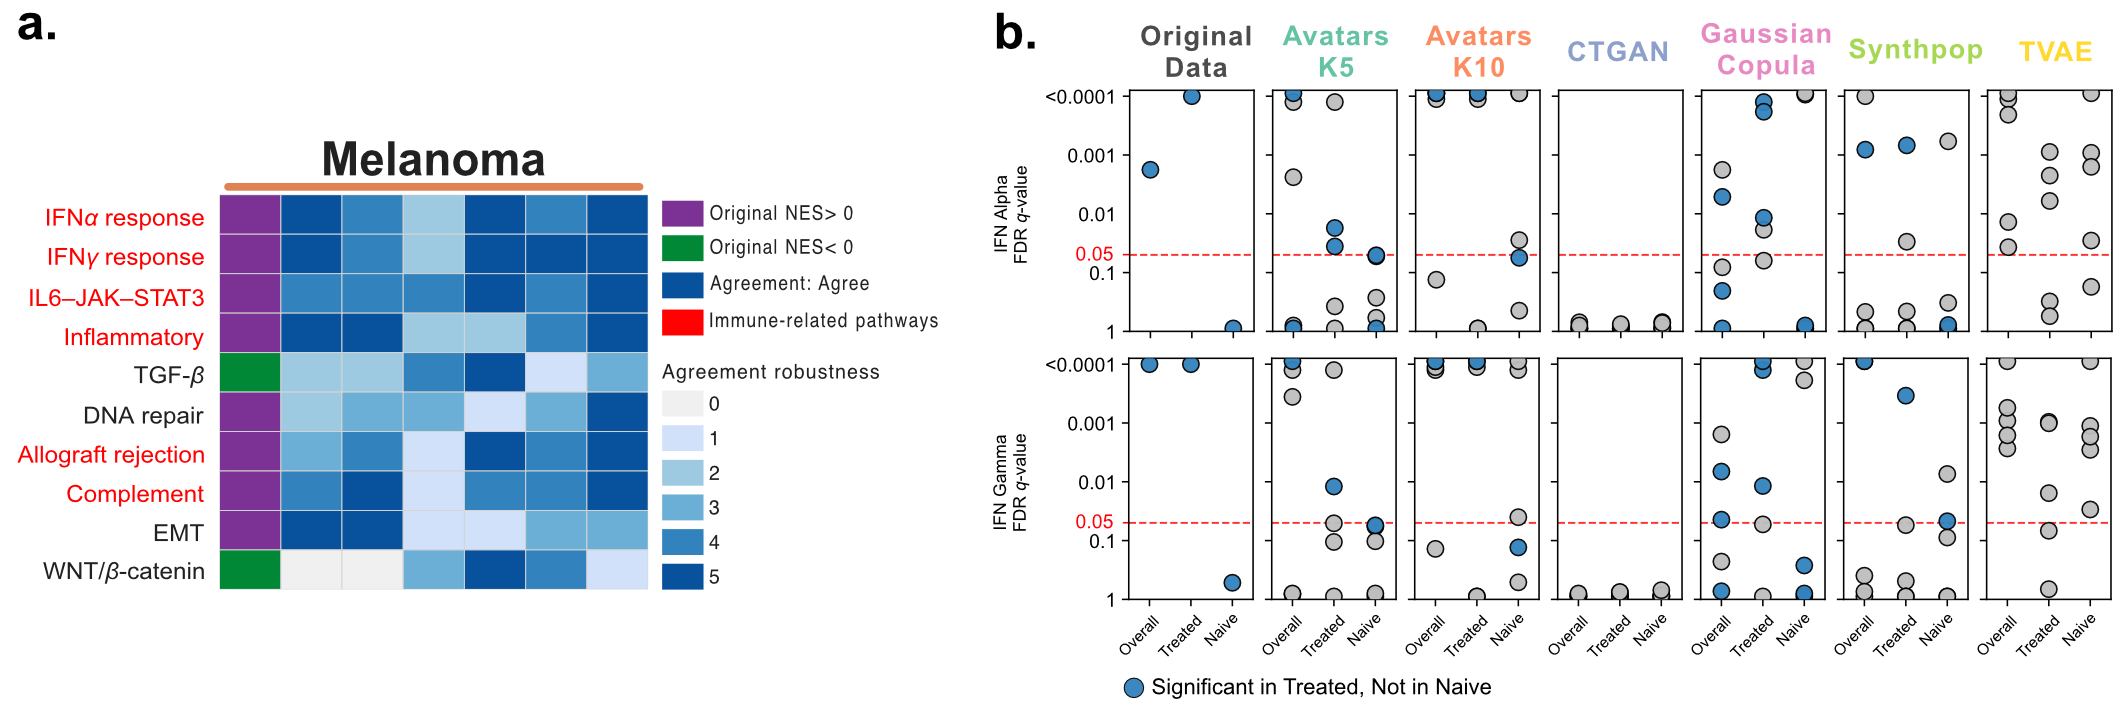 Figure 7: a) Directional agreement of key cancer pathways. Heatmaps display enrichment direction and agreement patterns for selected functional pathways in Melanoma. b) Treatment-stratified IFN response in the Melanoma cohort (orange strip). Dot plots present FDR q-values for IFN-γ and IFN-α response pathways stratified by prior ipilimumab exposure.
Liu et al. further reported significant enrichment of IFN-γ and IFN-α response pathways in ipilimumab-treated responders (FDR Q < 0.0001 for both), while no such enrichment was observed in the ipilimumab-naive subgroup. Gaussian Copula successfully reproduced this differential enrichment pattern (IFN-γ FDR Q = 0.0012 for treated, Q = 0.997 for naive; IFN-α FDR Q = 0.0012 for treated, Q = 1.0 for naive). Avatars K10 and Synthpop partially captured these signals, each recovering only one pathway. Gaussian Copula showed superior robustness, with three out of five replicates reproducing the subgroup effect (Figure 7b).
Single-sample GSEA
In the original study, the combination of MHC class II score, LDH level, and lymph node metastasis status was reported to have strong prognostic performance for predicting progression in ipilimumab-treated patients. To assess transferability, models were trained exclusively on synthetic data and evaluated on held-out folds of the original cohort using 5-fold cross-validation repeated three times (Figure 8). Logistic regression trained on original data achieved a mean ROC-AUC of 0.82. Models trained on synthetic datasets generated by Avatars (K5/K10), CTGAN, and Gaussian Copula achieved comparable performance. Notably, this positive result was most robust for Gaussian Copula, with three out of five replicates achieving statistically comparable ROC-AUC, whereas other SDG approaches yielded only one or two successful replicates. The learned coefficients for all three features were negative, and models trained on Avatars K10 and Gaussian Copula synthetic datasets consistently preserved this directional alignment across replicates.
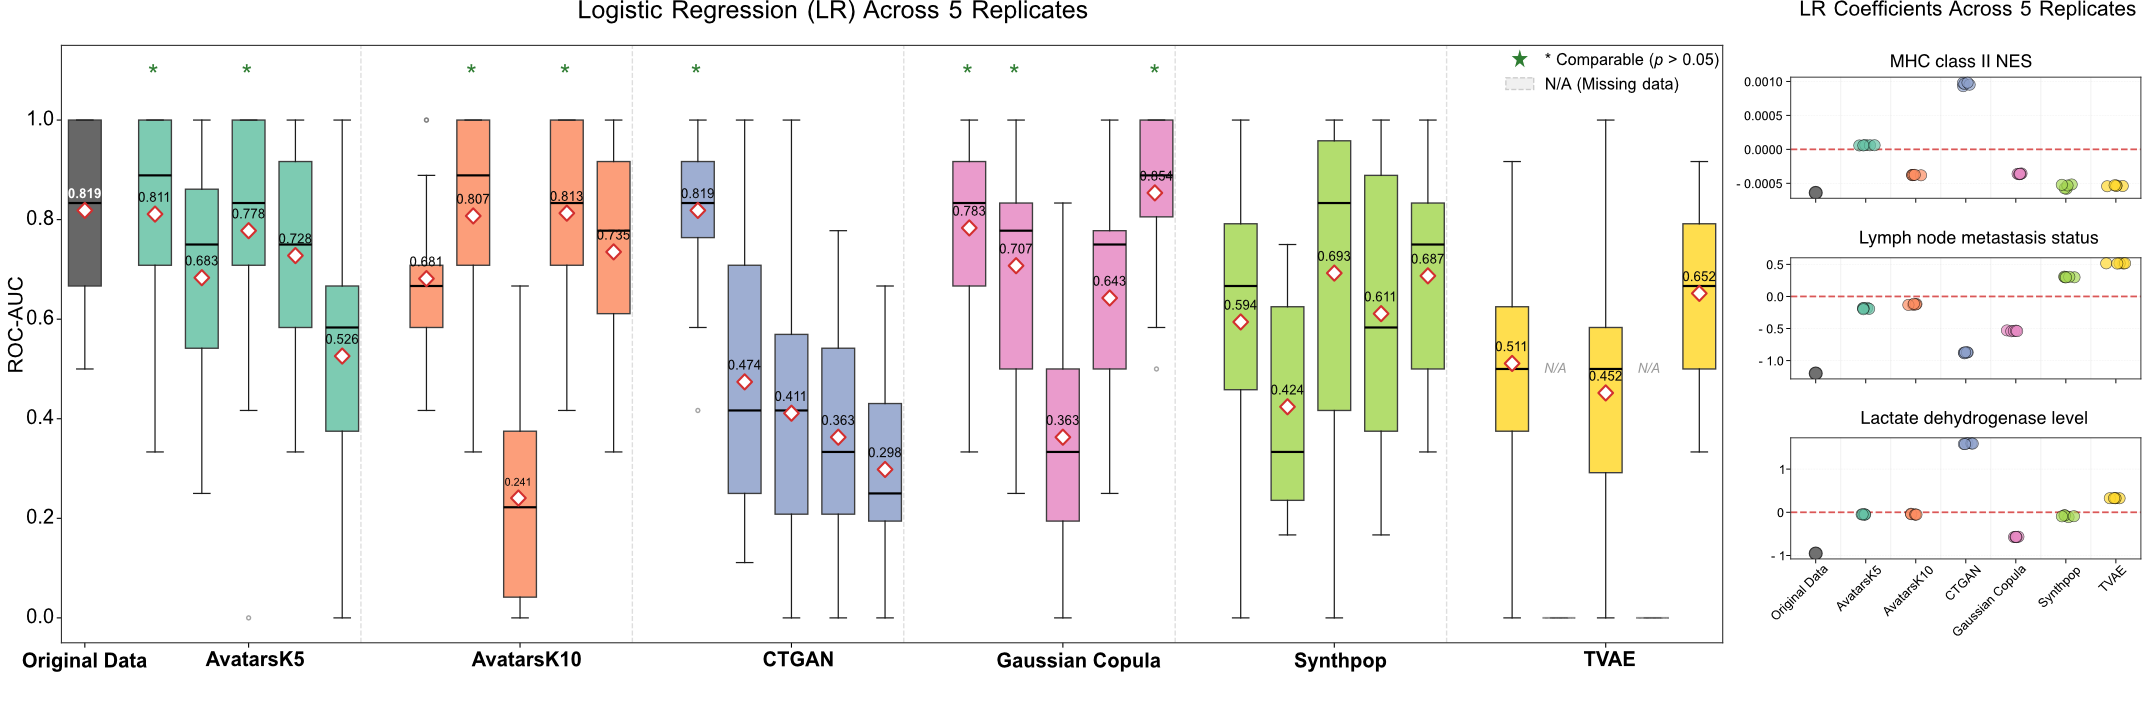 Figure 8: Predictive modeling transferability in Melanoma cohort. Boxplots depict cross-validated ROC-AUC for LR models trained on synthetic data replicates and evaluated on held-out original data (5-fold cross-validation, repeated three times). The original data benchmark is shown for reference. Colored dots indicate denote statistically non-inferior performance versus the original model (Wilcoxon signed-rank test, P<0.05). Right panels display learned coefficients for MHC class II score, lymph node metastasis status, and LDH level.
Cell Type Deconvolution
Using single-cell RNA-seq signatures reported by Jerby-Arnon et al., all immune signatures were enriched in responders in the original Melanoma cohort. Most SDG methods, except CTGAN, preserved the directionality of these signatures at a relaxed significance level (FDR Q < 0.25). However, only Gaussian Copula and TVAE showed consistent agreement for the most significant immune signatures (Q < 0.25), including overall immune infiltration, cytotoxic and exhausted CD8+ T cells, CD4+ T cells, B cells, and macrophages (Figure9a). Notably, TVAE frequently produced highly significant results alongside apparent effect-size inflation, accompanied by extreme label imbalance in responder-to-progressor ratios (ranging from 10.1% to 692.9%, compared with 83.9% in the original cohort).
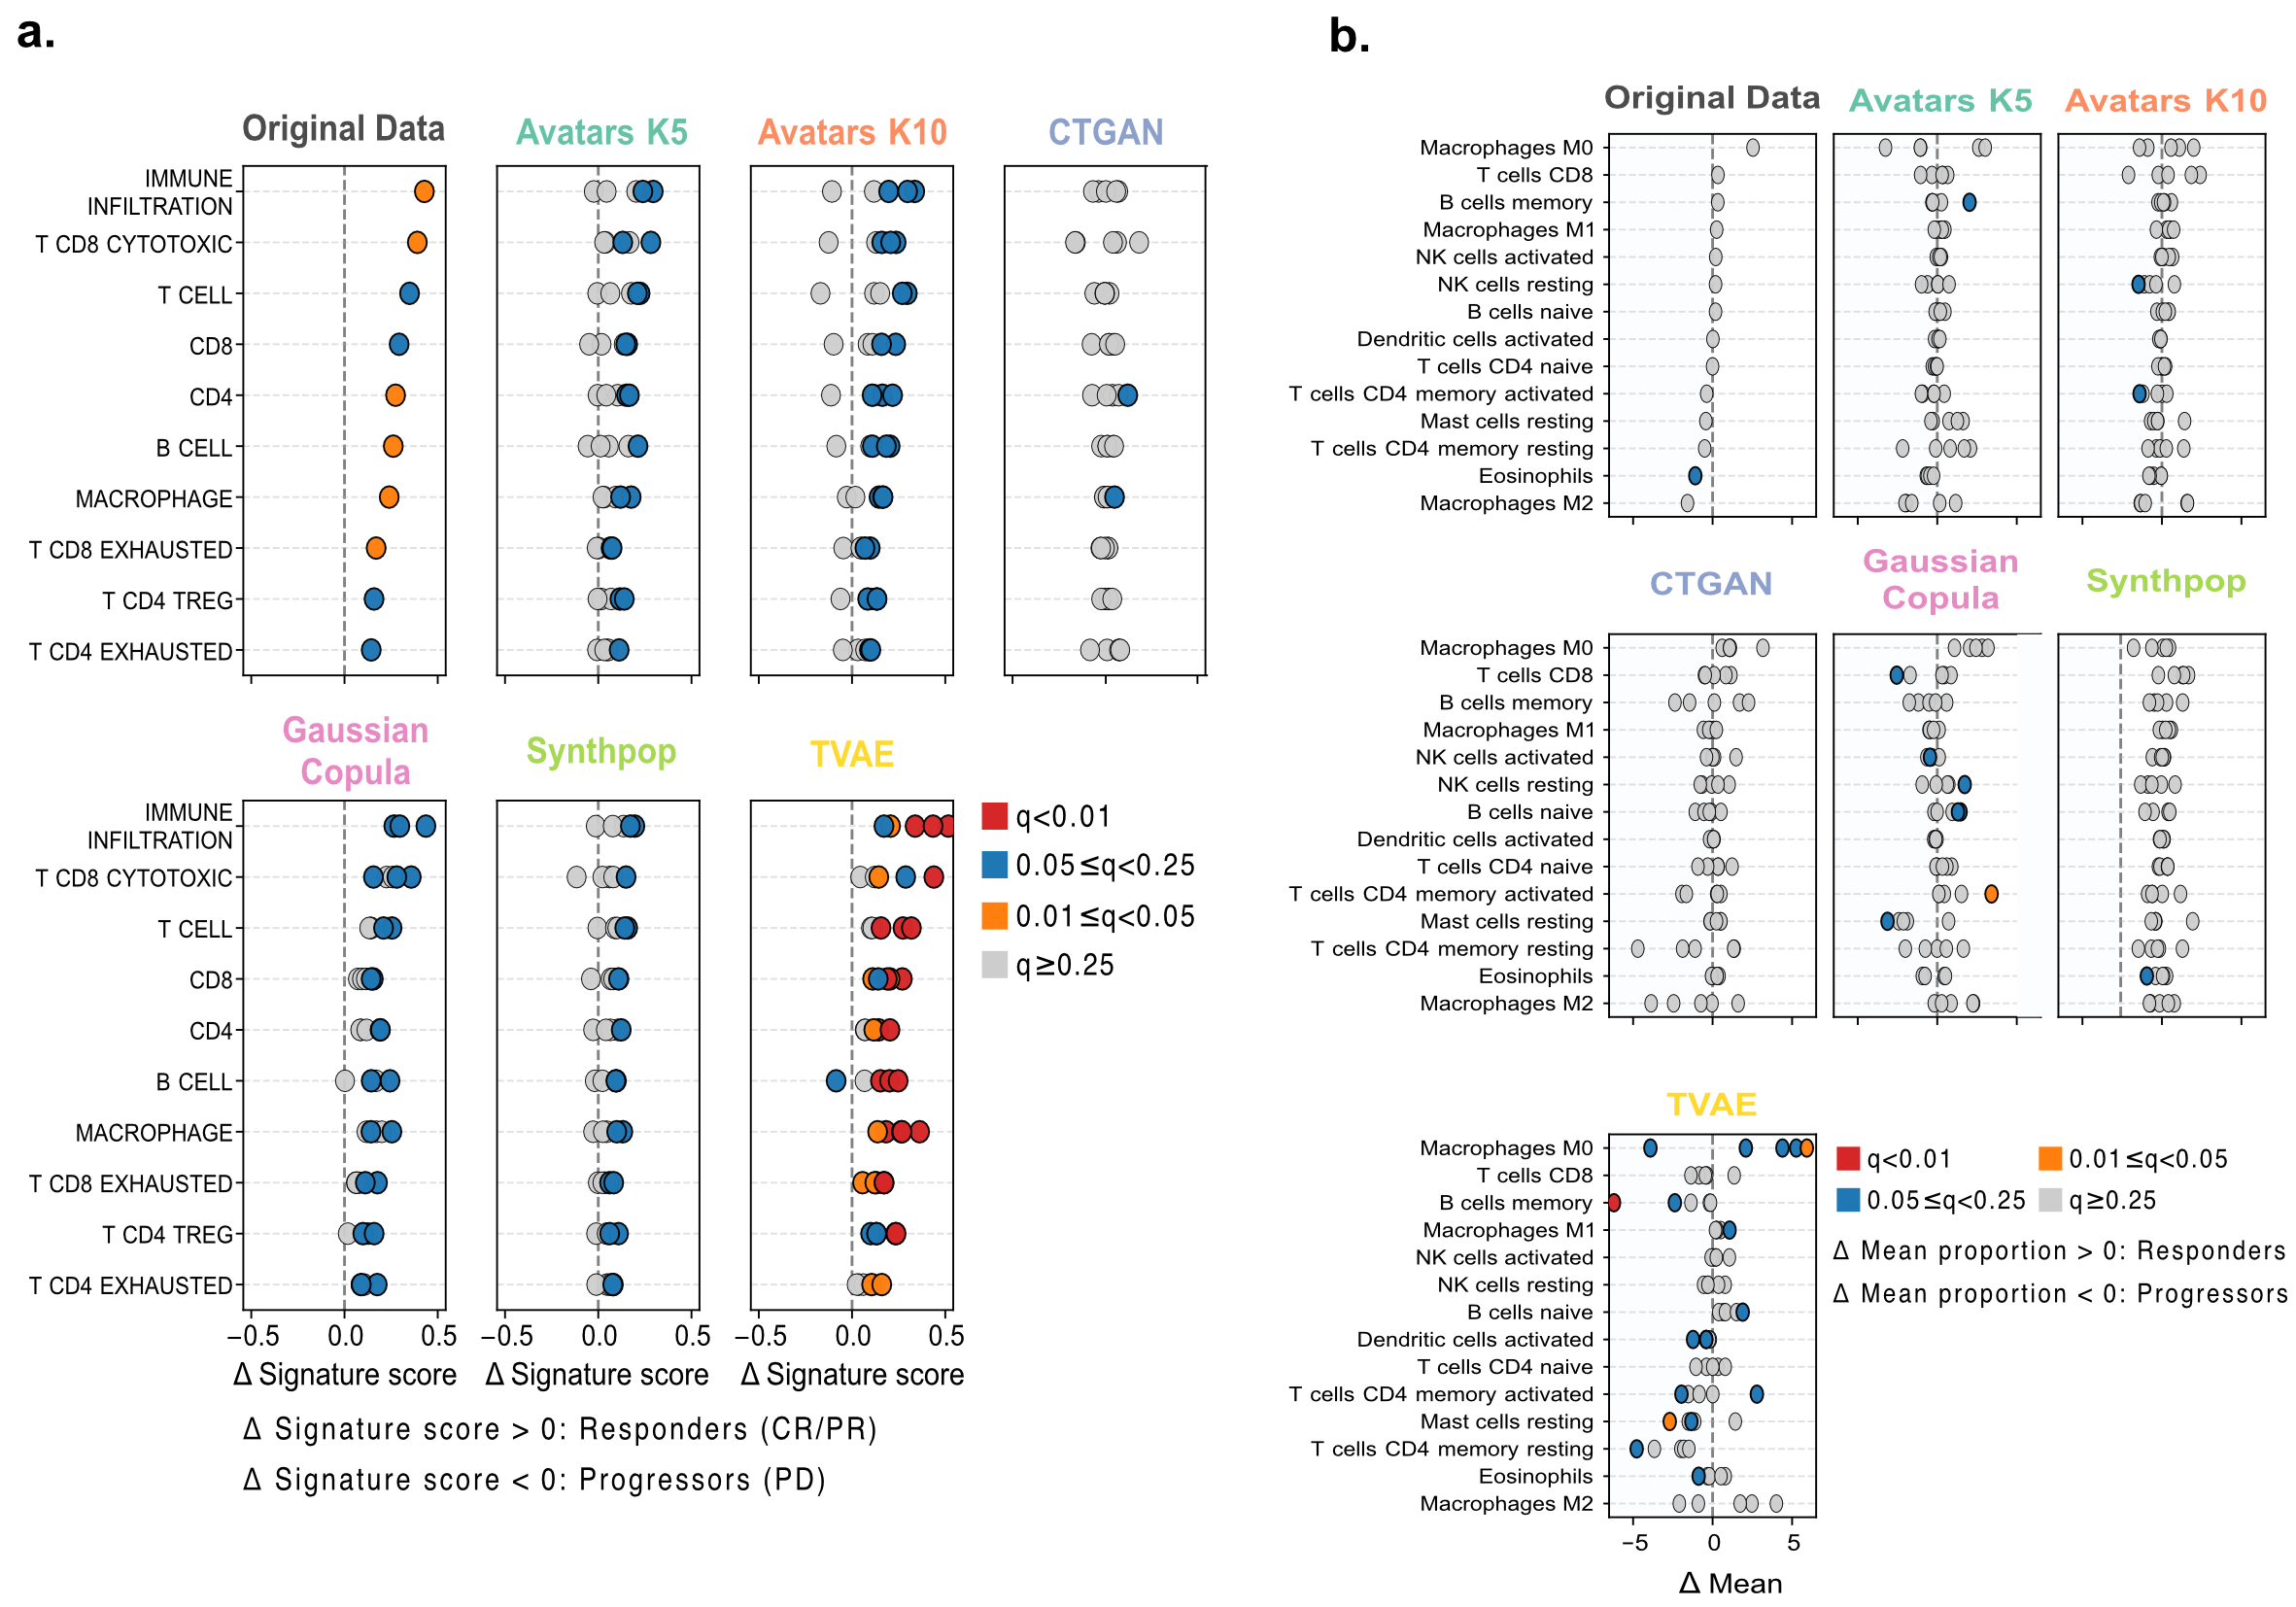 Figure 9: a) Recovery of single-cell-derived immune signatures in Melanoma. Dot plots show the mean differences of signature score between responders and progressors for immune programs derived from single-cell RNA-seq. The colors represent FDR-adjusted significance thresholds from a two-sided Wilcoxon rank-sum test. b) Differential LM22 immune cell proportions in Melanoma cohort. Dot plots compare mean differences in immune cell fractions inferred by CIBERSORTx between responders and progressors.
In the LM22-based analysis, differential analyses between responders and non-responders revealed no significant immune cell type differences in the original data; accordingly, SDG methods did not produce stable signals in this setting (Figure 9b).
Survival Analysis
Liu et al. developed a parsimonious predictive model integrating MHC-II ssGSEA scores with genomic features to stratify progressors and non-progressors. We re-implemented this modeling framework using classifiers trained on synthetic datasets and conducted survival stratification (Figure 10). Only Gaussian Copula consistently reproduced this survival separation for both PFS (log-rank test, P < 0.05) and OS (log-rank test, P < 0.05). TVAE showed preservation for PFS (P < 0.01), but could not preserve OS stratification. Overall, Avatars and Gaussian Copula maintained significant OS and PFS separation, while TVAE markedly distorted the responder-to-non-responder ratio (84% vs. 10%). CTGAN and Synthpop did not preserve significant OS or PFS differences.
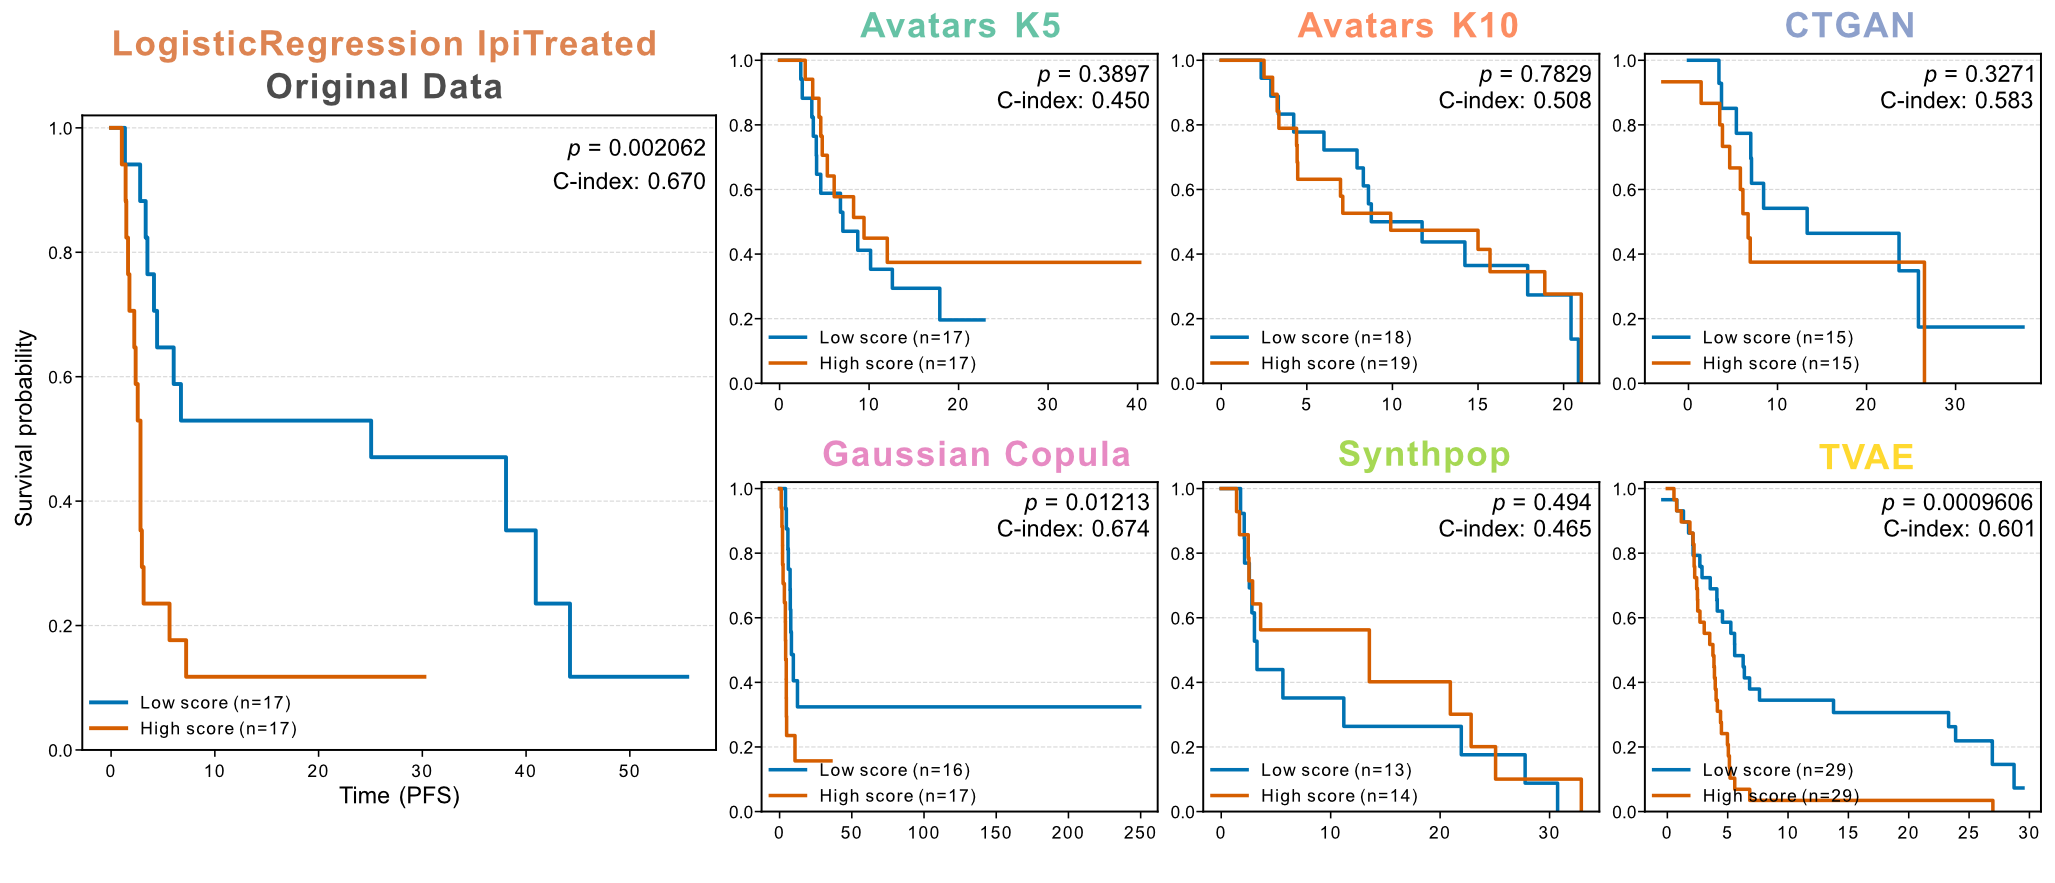 Figure 10: Preservation of survival stratification based on a predictive model in the ipilimumab-treated Melanoma cohort. Kaplan-Meier curves of PFS stratified by predicted risk groups (low risk: blue; high risk: orange) derived from a logistic regression model classifying progressors versus non-progressors. The model was retrained on each synthetic dataset, and predicted risk scores were used for survival stratification. Log-rank P values and C-indices are reported in each panel.
NSCLC
Cohort: 152 patients with advanced non-small cell lung cancer from the Stand Up To Cancer-Mark Foundation (SU2C-MARK) cohort, treated with PD-1/PD-L1 blockade. Original study by Ravi et al. (Nature Genetics, 2023).
Ravi et al. performed the first integrative analysis of genomic and transcriptomic biomarkers in a large NSCLC-specific ICB cohort, revealing that myeloid-driven immune programs — particularly immunoproteasome components and macrophage/monocyte signatures — play a central role in determining checkpoint blockade response.
Differential Gene Expression
The authors reported a convergence of differentially expressed genes (PSME1, PSME2, PSMB8, PSMB9, and PSMB10) within the immunoproteasome system, which was significantly enriched in responders relative to canonical Hallmark IFN-γ targets as well as a comprehensive list of proteasome components (Wilcoxon rank-sum test, P < 0.01). This hierarchical enrichment pattern—the upregulation of immunoproteasome components relative to IFN-γ targets and general proteasome genes—was successfully re-discovered in synthetic datasets generated by Avatars K10 and Gaussian Copula (Figure 11).
 Figure 11: Re-discovery of immunoproteasome enrichment in NSCLC. Signed \(-log_{10}(p-value)\) distributions compare IFN-γ response genes, immunoproteasome (iPSM) components, and canonical proteasome genes between responders and non-responders. Statistical significance was assessed using a two-sided Wilcoxon rank-sum test.
Gene Set Enrichment Analysis
In NSCLC, both responder-associated (IFN-γ response, Allograft rejection, DNA repair) and non-responder-associated (EMT, WNT β-catenin, TGF-β signaling) pathways were recapitulated with varying degrees of robustness. TVAE demonstrated directional agreement across all these pathways in at least three out of five replicates. While Gaussian Copula and Synthpop showed consistent alignment with responder-associated pathways, Avatars (K5/K10) exhibited more robust agreement across replicates for non-responder-associated pathways (Figure 12).
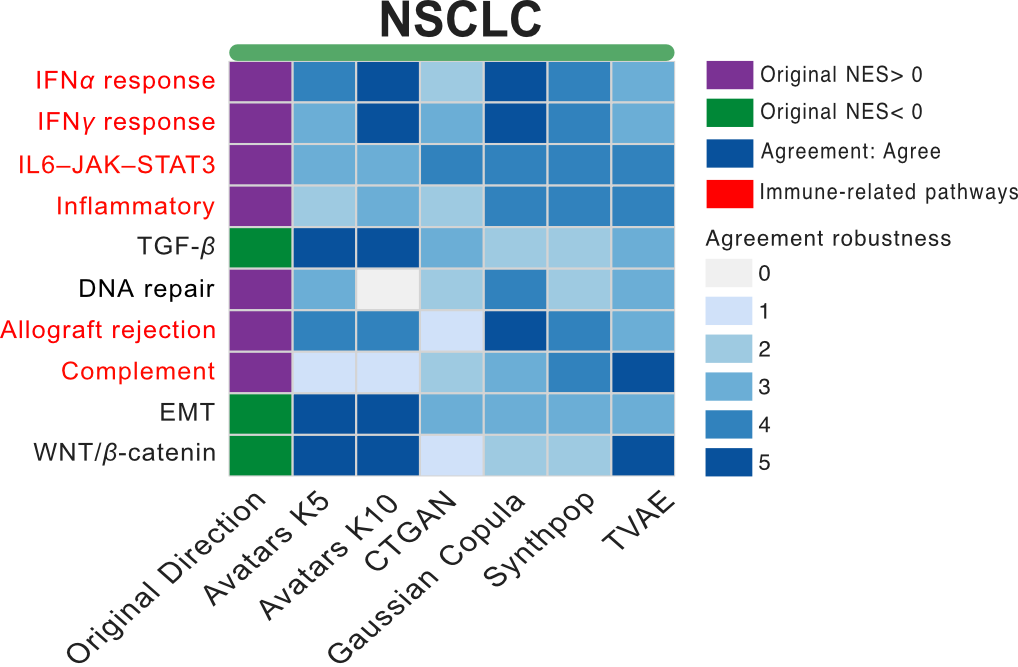
Figure 12: Directional agreement of key cancer pathways. Heatmaps display enrichment direction and agreement patterns for selected functional pathways in NSCLC.
Cell Type Deconvolution
Ravi et al. identified strong associations between resistance and myeloid-driven immune programs, including monocyte/macrophage and dendritic cell signatures (Figure 13a). While the association direction was partially recovered in several synthetic datasets, the level of significance varied across replicates.
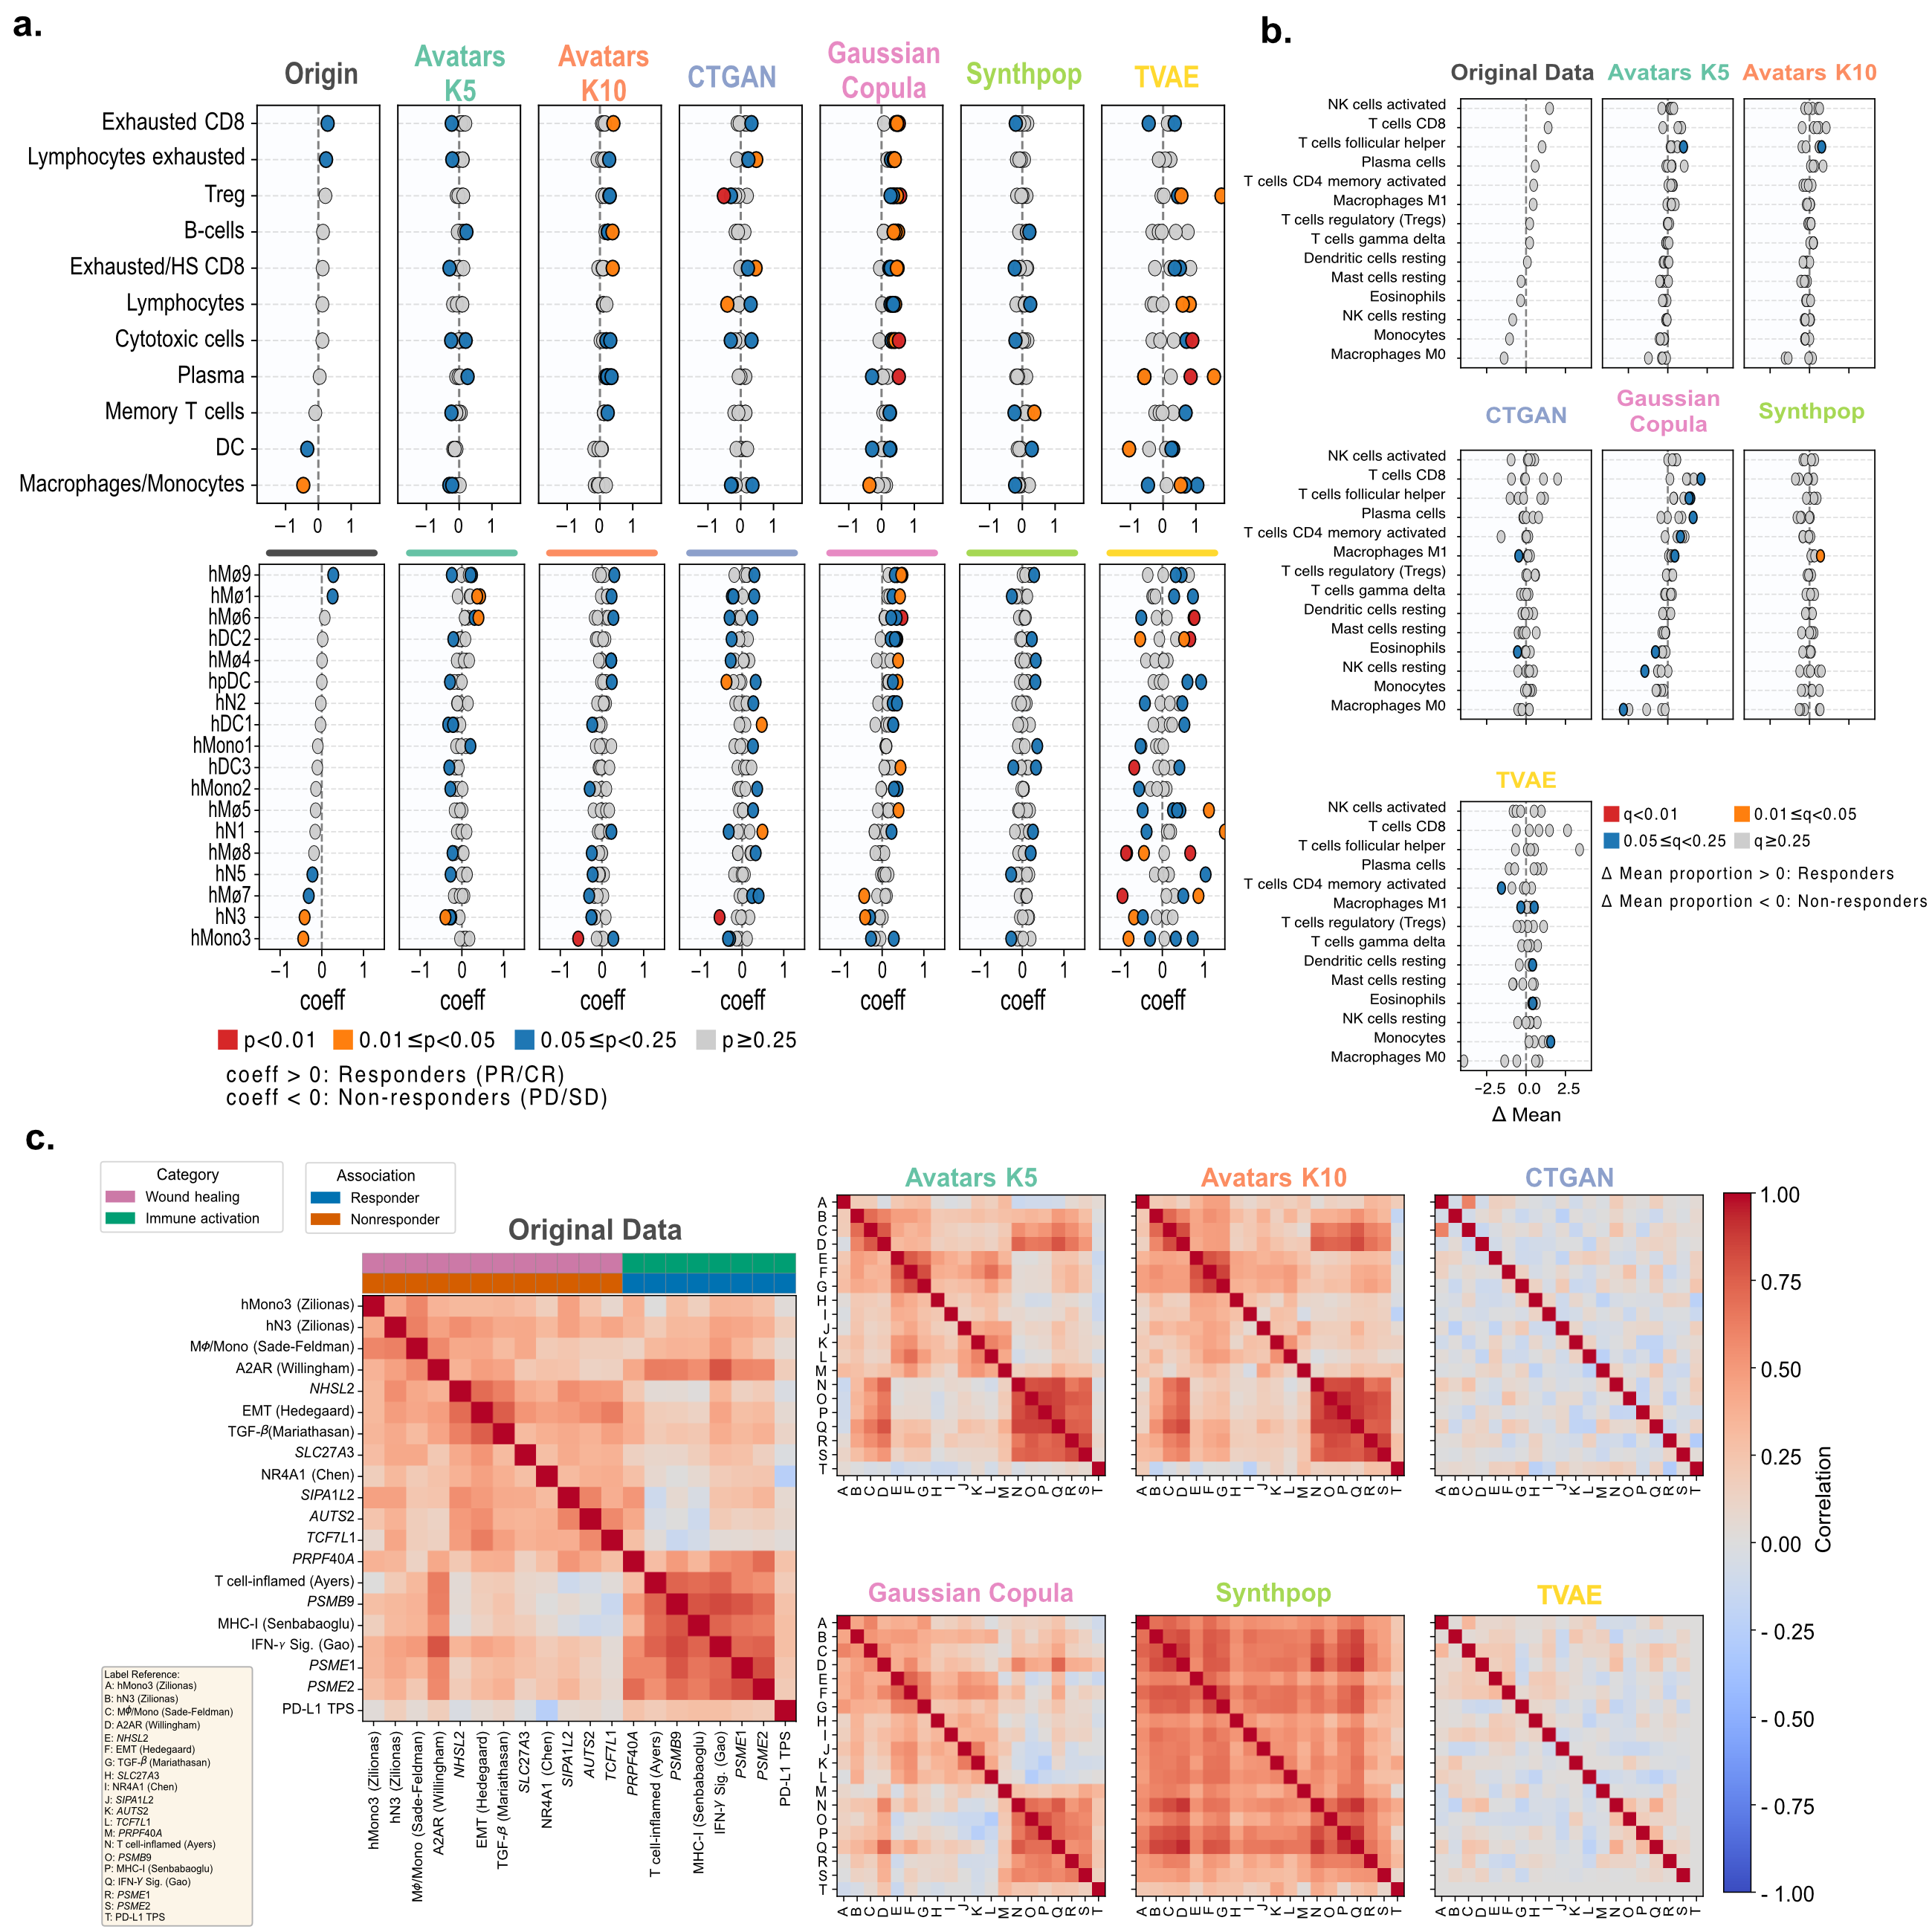 Figure 13: a) Recovery of single-cell-derived immune signatures in NSCLC cohort. Dot plots show the mean differences of signature score between responders and non-responders for immune programs derived from single-cell RNA-seq. The colors represent FDR-adjusted significance thresholds from a two-sided Wilcoxon rank-sum test. b) Biological signature correlation matrices in the NSCLC cohort. Correlation heatmaps display pairwise Pearson correlations among signatures in the original data and each synthetic dataset. The color scale ranges from negative (blue) to positive (red) correlations. Clustering highlights two principal modules: a resistance-associated wound-healing/immunosuppressive, stromal cluster (C1) and a response-associated immune activation/exhaustion cluster (C2). c) Differential LM22 immune cell proportions in NSCLC cohort. Dot plots compare mean differences in immune cell fractions inferred by CIBERSORTx between responders and non-responders.
To further probe higher-order immune organization, integrative correlation analysis was performed. As illustrate in Figure 13b, in the original data, two well-separated clusters emerged: a wound-healing-associated cluster (C1) dominated by immunosuppressive myeloid, stromal, EMT, and TGF-β signatures linked to resistance, and an immune activation/exhaustion cluster (C2) enriched for immune infiltration, immunoproteasome components, and IFN-γ signaling associated with response. This two-module structure was clearly preserved in Gaussian Copula and Avatars K5 synthetic data, partially retained by Avatars K10, and largely lost in Synthpop, CTGAN, and TVAE.
In the LM22-based analysis, no significant immune cell type differences were observed between responders and non-responders in the original data, consistent with prior reports (Figure 13c).
Survival Analysis
Ravi et al. reported that among patients with high PD-L1 expression (TPS ≥ 50%), increased macrophage/monocyte infiltration was associated with reduced PFS despite otherwise favorable prognostic status. This clinically relevant survival signature was successfully recovered using Gaussian Copula synthetic data (log-rank test, P < 0.05), whereas none of the other SDG methods reproduced this association (Figure 14). Overall, Avatars and Gaussian Copula retained significant separation for both OS and PFS, while CTGAN, Synthpop, and TVAE failed to maintain survival discrimination for either endpoint.
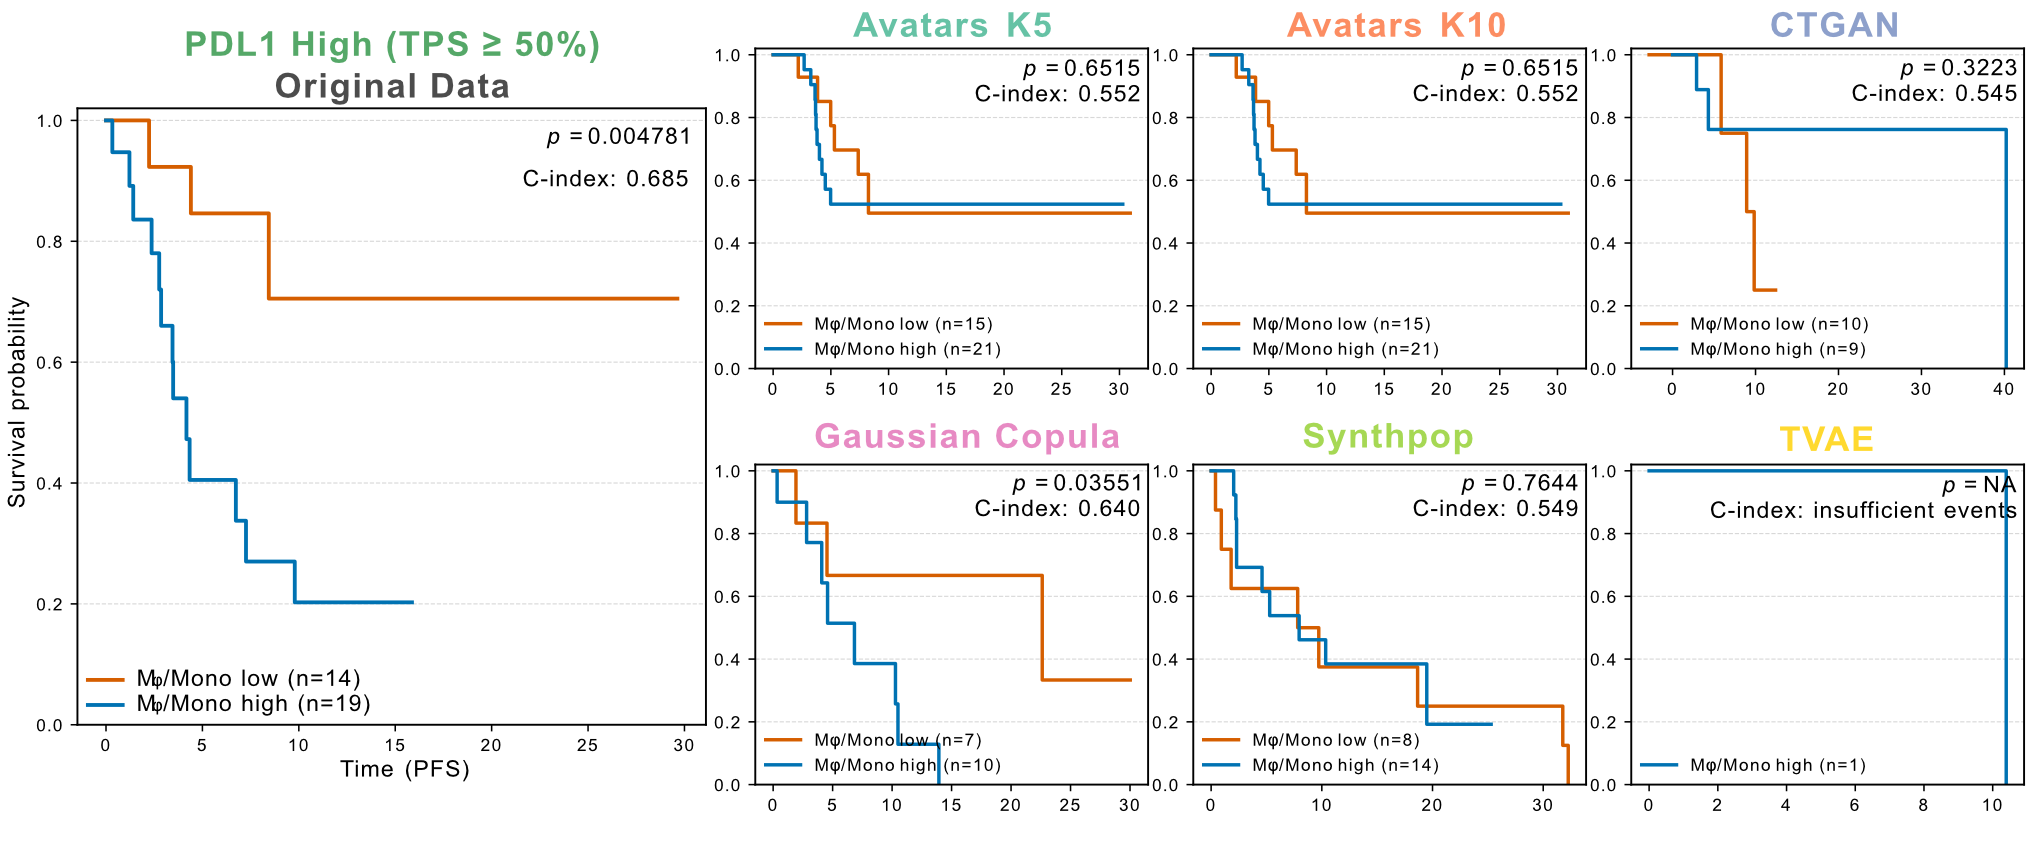 Figure 14: Patient stratification using a macrophage/monocyte signature in the PD-L1 high NSCLC cohort. Kaplan-Meier curves evaluate progression-free survival differences between tumors with low (orange) versus high (blue) macrophage/monocyte aignaturescores within the PD-L1 high (TPS ≥ 50%) subgroup. Recovery of the adverse prognostic association observed in the original dataset is assessed across SDG methods. Log-rank P values and C-indices are shown in each panel.
Summary
Across all three cancer cohorts and five analytical tasks, Gaussian Copula emerged as the most consistent method for preserving biologically meaningful signals — from gene-level markers and pathway enrichment patterns to immune cell compositions and survival stratification. The two Avatars configurations (K5/K10) shared a strong runner-up position, successfully re-discovering most biological insights though with greater inter-replicate variability. Importantly, methods with high statistical fidelity scores (such as Synthpop) did not necessarily preserve complex biological relationships, reinforcing the need for biological validation beyond metric-based assessment.
These results demonstrate that synthetic data can support biological hypothesis generation, but that careful method selection and multiple synthetic realizations are essential for reliable inference.